#
Run page
On the Run page you can configure and run Procedures, dig into Procedure output, and review Procedure history for an Operation.

Note
Windows support is available at this time and Mac support will be available at a later date.
#
Running an operation
Use the steps below to run an Operation.
Filter the list of agents displayed in the Agents field group and select the one you'd like to run.
From the first drop-down list, select the Platform: All Agents, Windows, or Linux.

From the second drop-down list, select the agent connection status: All Agents or Active Agents.

If you haven't yet set up an agent, see the Agents section of this guide for how to do so.
Select an optional procedure or a playbook from the Select Procedure or Select Playbook drop-down lists on the Plan tab.

To view procedures grouped by tactics, playbooks, or tags, select the Tree View icon next to the Select Procedure field to display the Add Procedures dialog box -> select the filter to the right of the All filter and select Tactics, Playbooks, or Tags.

As you add procedures and/or a playbook, all the procedures selected (or associated with the playbook) display in the Plan table below the Select Procedure drop-down list.

Select any Procedure row to display its details in the right, lower section of the page.

From here you can edit the visibility on the Visibility tab, view the procedure details and activity log, upload files, view related tags, and modify the settings. Each procedure will have different settings depending on its particular requirements.
Select the blue Run button. Once the Operation begins to run, focus moves to the Execute tab, where you can see the status of your queued Procedures.
Once the Procedures have run, select the History tab to view the result.
Select a Procedure to see the results on the right side along with the Details and Settings.
The results include:
- The time it was run, how long it took to run, the Execution and Operation status.
- The Detection Categories
- Agent details
- Verbose Output
#
Using the Event Viewer for integration data
The Event Viewer displays your integration's data in JSON formatted results for items detected during an operation's run.
Required
An integration must be configured on the BAS Integrations page (Settings -> BAS Integrations) in order to use the Event Viewer.
Below are the high-level steps to view your integrations data in the Event Viewer.
Install a BAS agent.
Navigate to Run page and select your agent.
Run the operation. Then:- A. Select the History tab.
- B. Select a procedure for the historical run.
- C. Then select its Visibility tab in the right, lower section of the page.
- D. View the Event Viewer button.
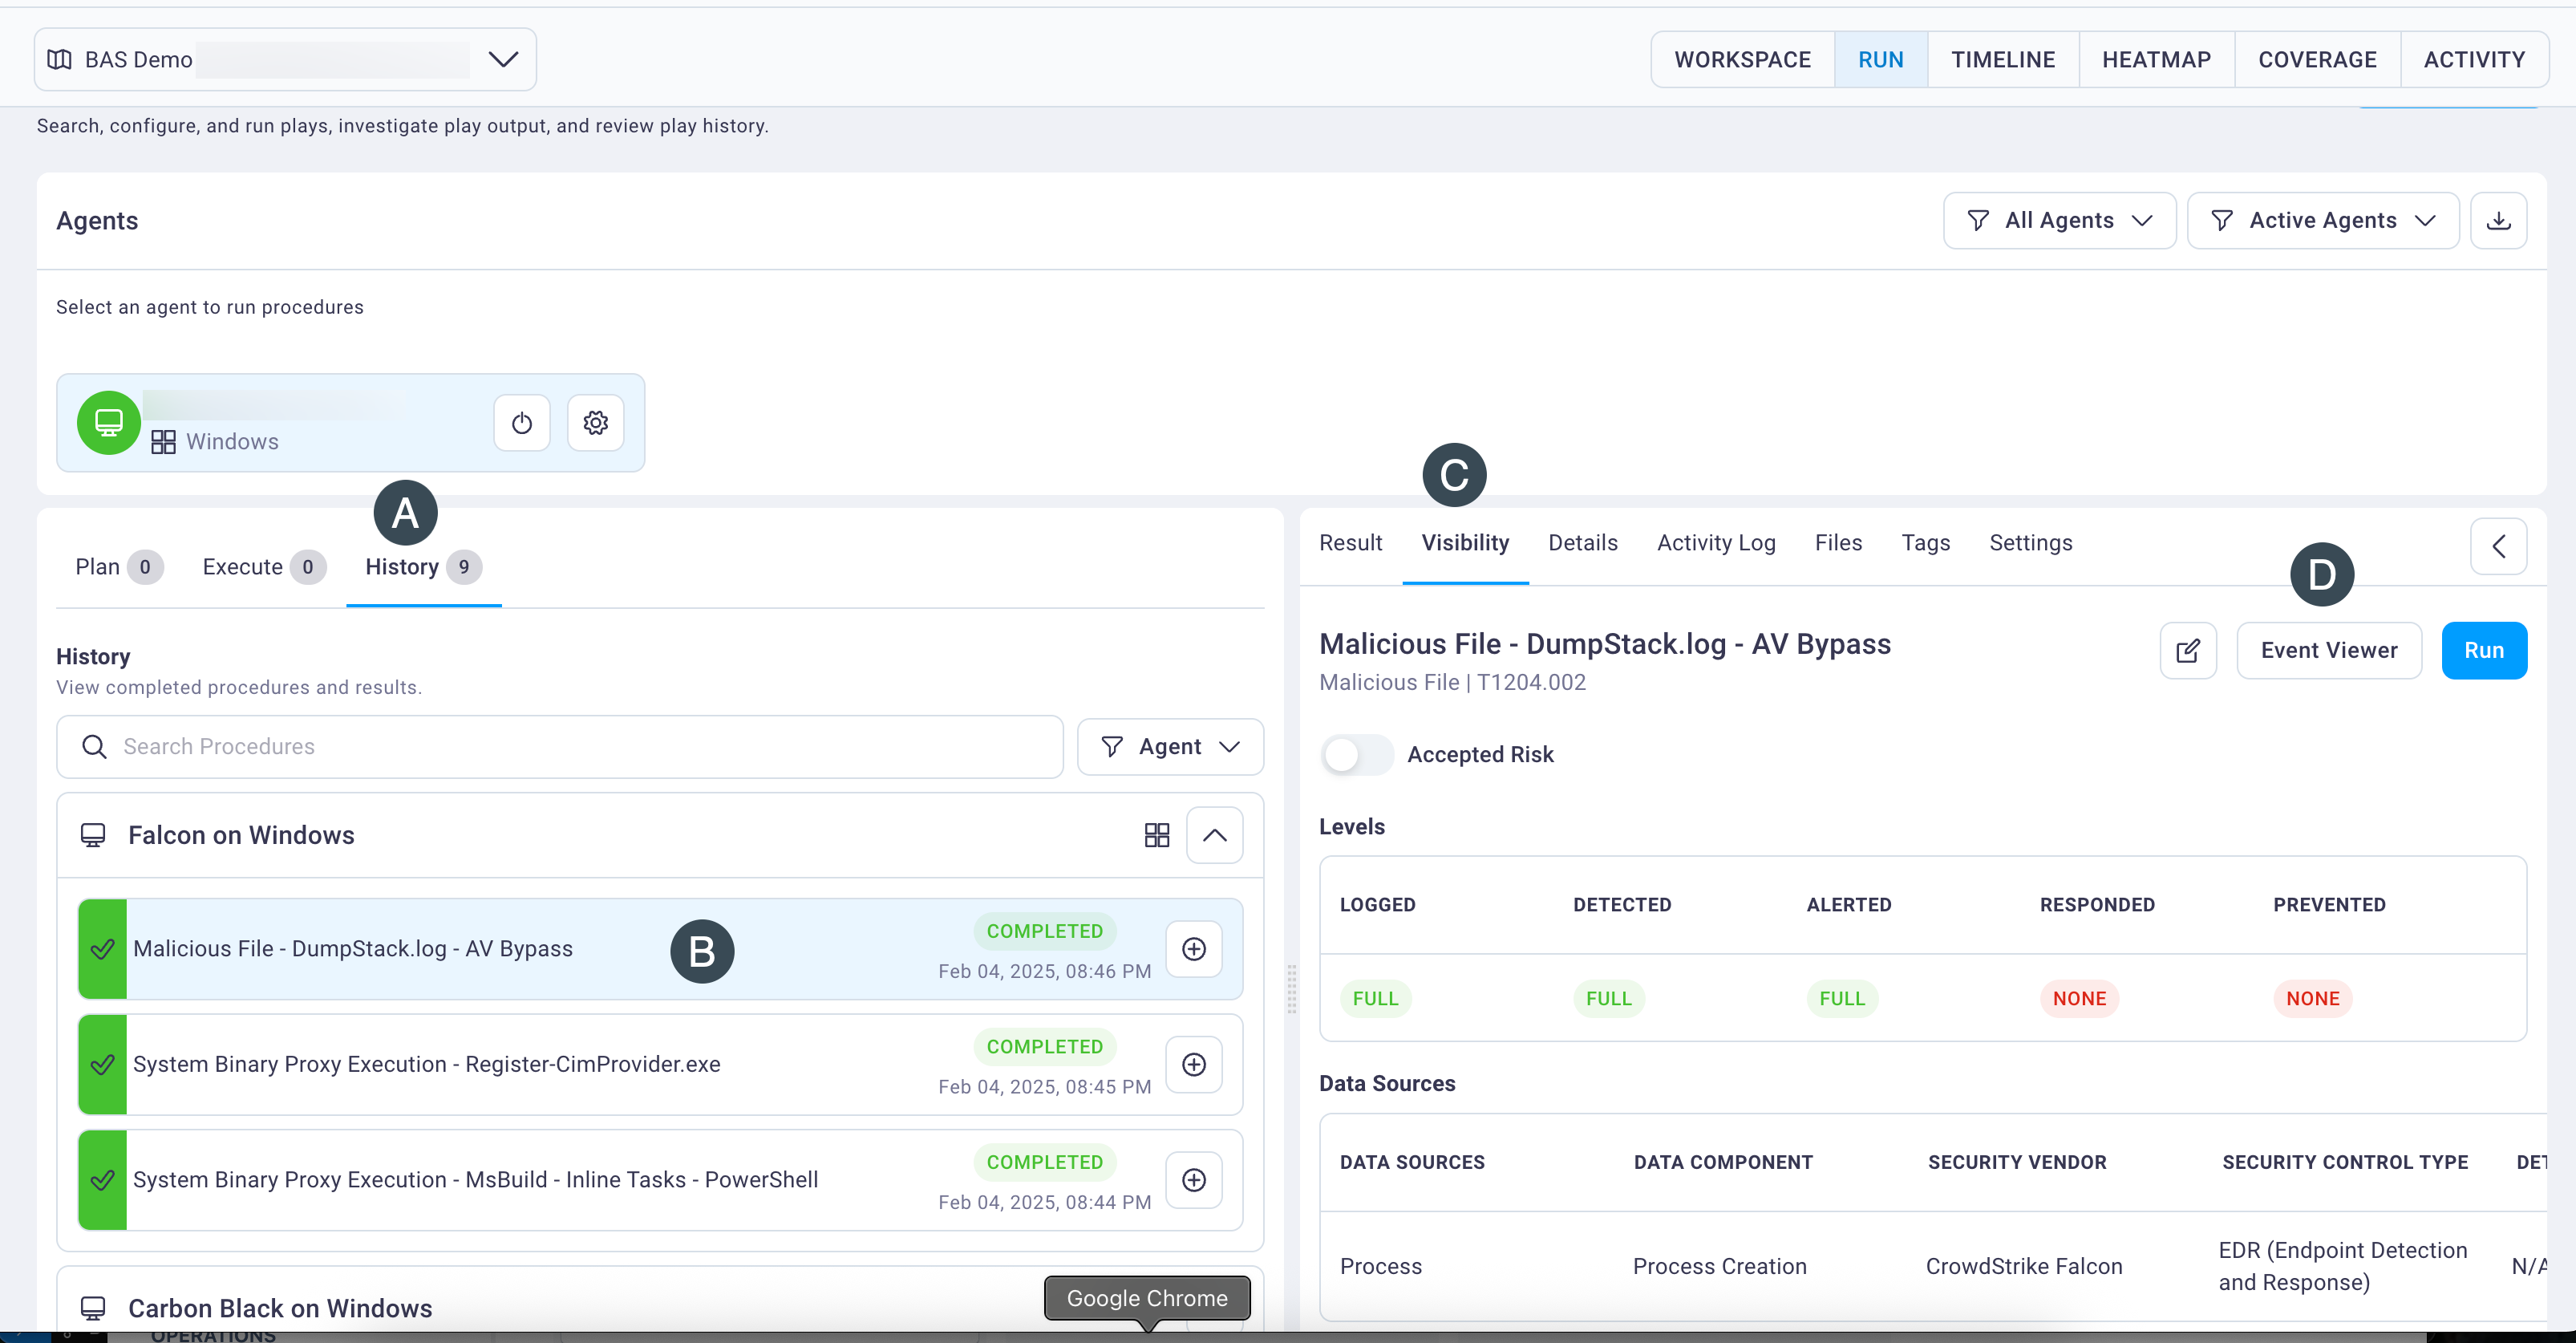
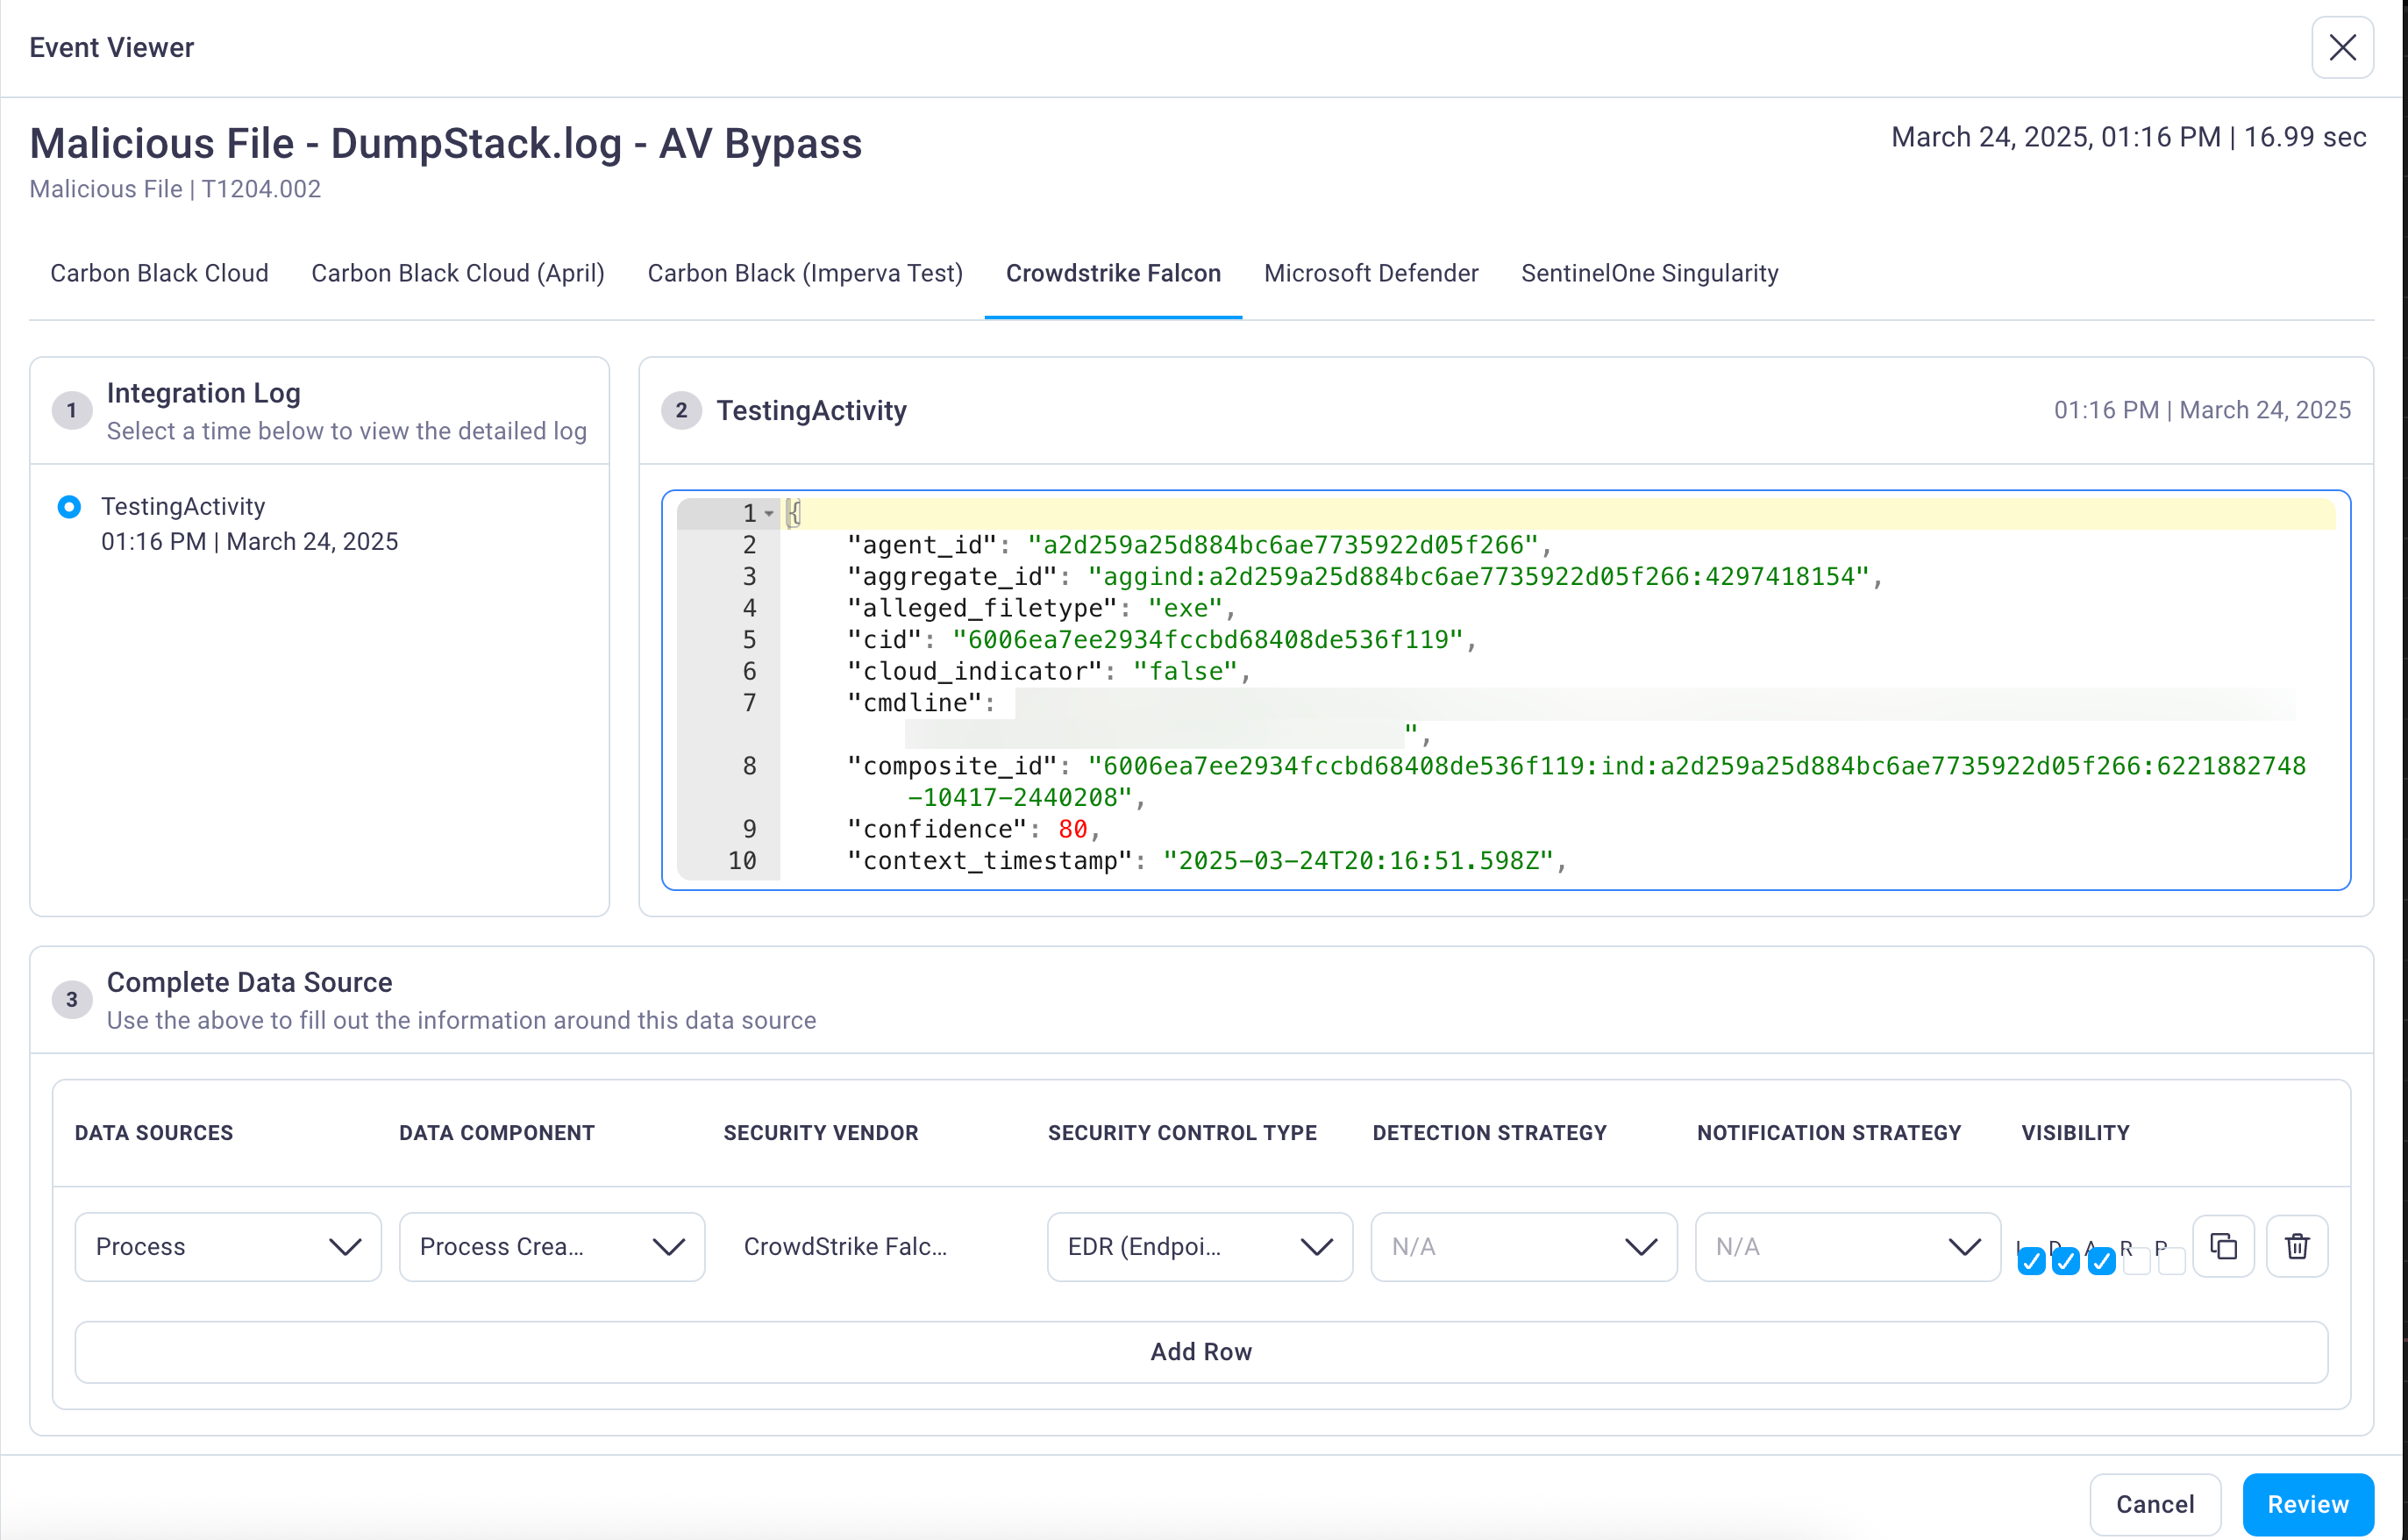
Select the Event Viewer button to display the Event Viewer screen and select your integration's tab to view its output in JSON format.
#
Add or edit data sources
If you have not yet added data source information for your integration, you can add it in the Complete Data Source field group and rerun the operation to view results.
Select each desired integration tab to set the log viewing time, the detection name, and the data source.
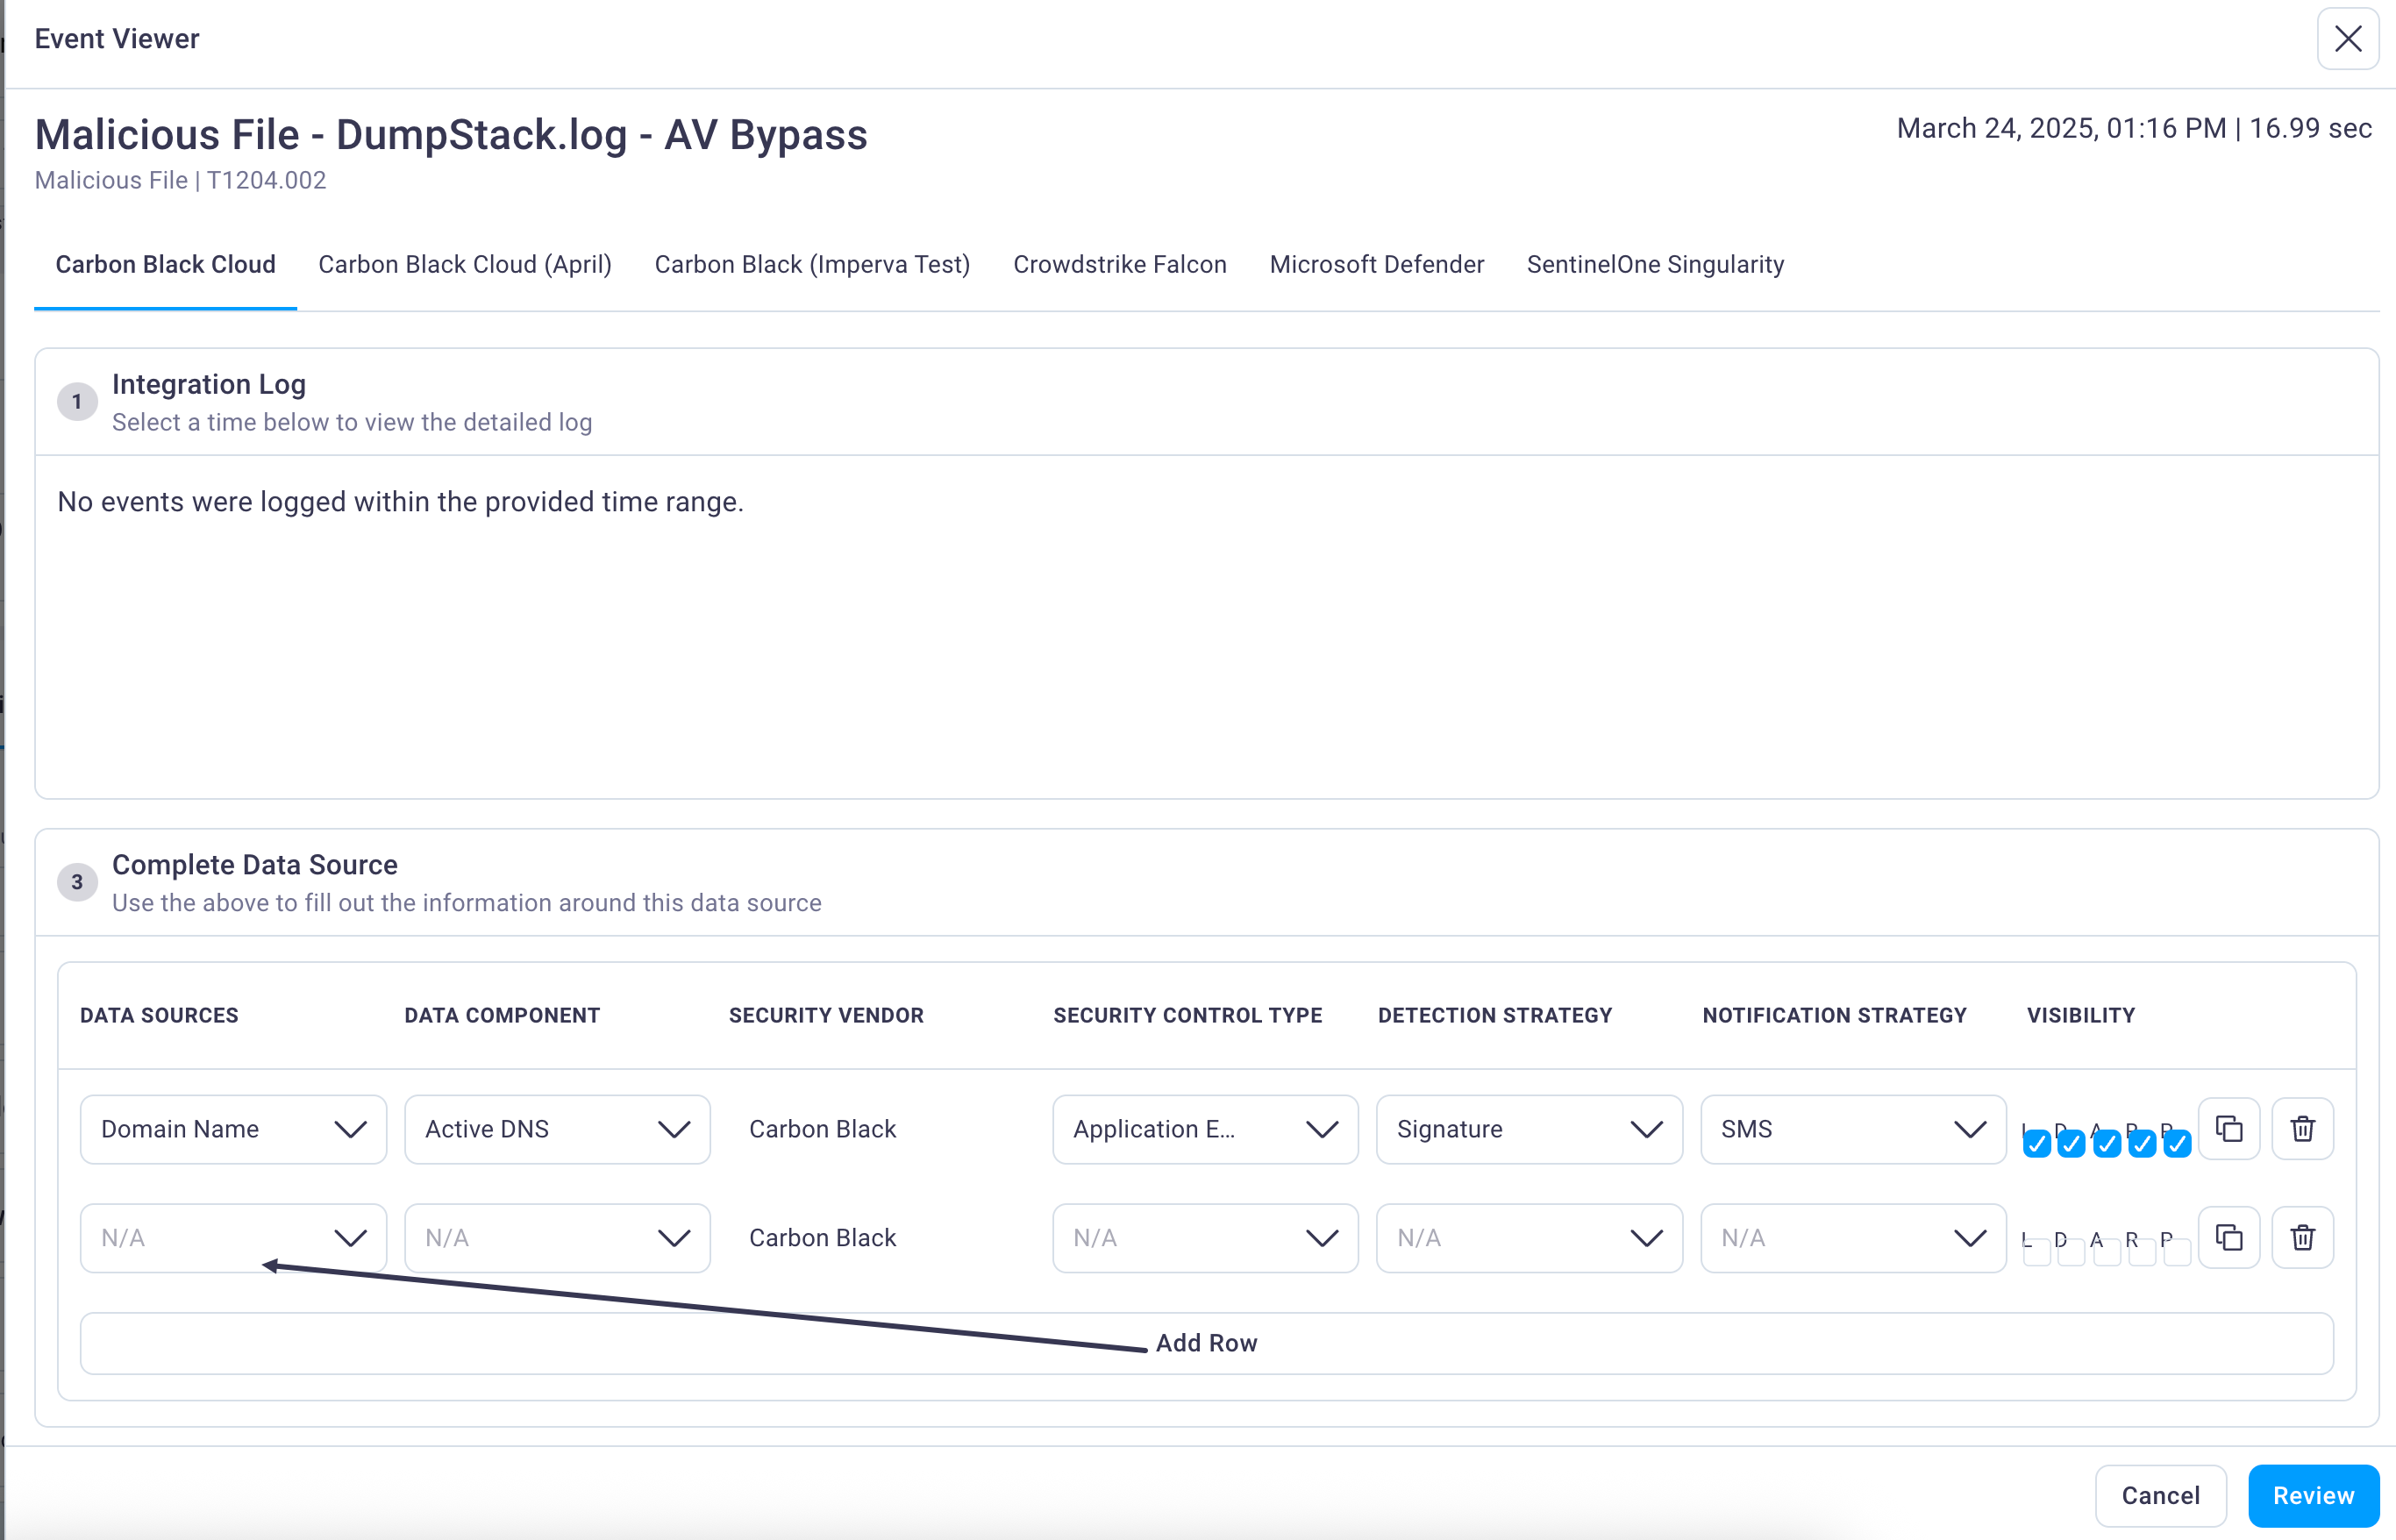
Add multiple data sources as desired (by selecting Add Row), and select Review and then Save and Close when done adding or editing the data source.
Run the operation, or follow the steps described above for a new integration and then run the operation, to view the integration data in the Event Viewer.
Note
You may need to wait a minimum of 15 to 30 minutes for integration detection results to display after an operation's run completes.