#
CAASM Overview
The CAASM Overview page provides asset visibility and coverage for your organization. It is a base from which you can:
- Defend your assets
- Identify assets you don't want, assisting attack surface reduction
You'll see your cyber asset attack surface with assets broken down by:
Asset types , total assets and specific asset typesAsset classes , e.g., sorted tables for Applications, Operating Systems, Cloud Resources (cyber hygiene)Asset vulnerability level , top 10 assets sorted by severity level (what needs to be addressed now)Assets with findings displayed by highest severity level for associated finding (what needs to be addressed now)- Integrations that provide
asset insights

#
1. Asset cards
A row of asset cards across the top of the page provides a real-time count of your organization's most common assets discovered by CAASM. These provide an understanding of what assets you have so you know what you need to protect.

Selecting any of the cards displays the NetSPI Platform Asset Inventory page filtered to provide focus on the selected asset class. You can see all of the different types of assets, and dig into them if you want to get details.
From there you can view Asset details for each individual asset.
Your assets are all discovered and displayed in the NetSPI Platform's CAASM module based on your integrations. See the CAASM Integrations section of this guide for details on setting up your first integration if you haven't done so already.
#
2. Asset classes
The asset classes field groups display CAASM-discovered assets by Applications, Operating Systems, and Cloud Resources along with the instance count for each. The information accessed via these asset tables inform your understanding of your current asset hygiene. For example, you can quickly identify where you have products that have a high number of versions, indicating where you need to improve patch management or version control.

You can search, sort, and page through the asset tables. Selecting any of the asset classes' table rows displays the CAASM asset table, filtered for your selection. From there you can dive deeper into each asset's details.
#
Applications assets
The Applications table's default display shows the asset with the highest version count first. This alerts you to the number of different versions your organization has of any asset, some of which may be out of date, etc.
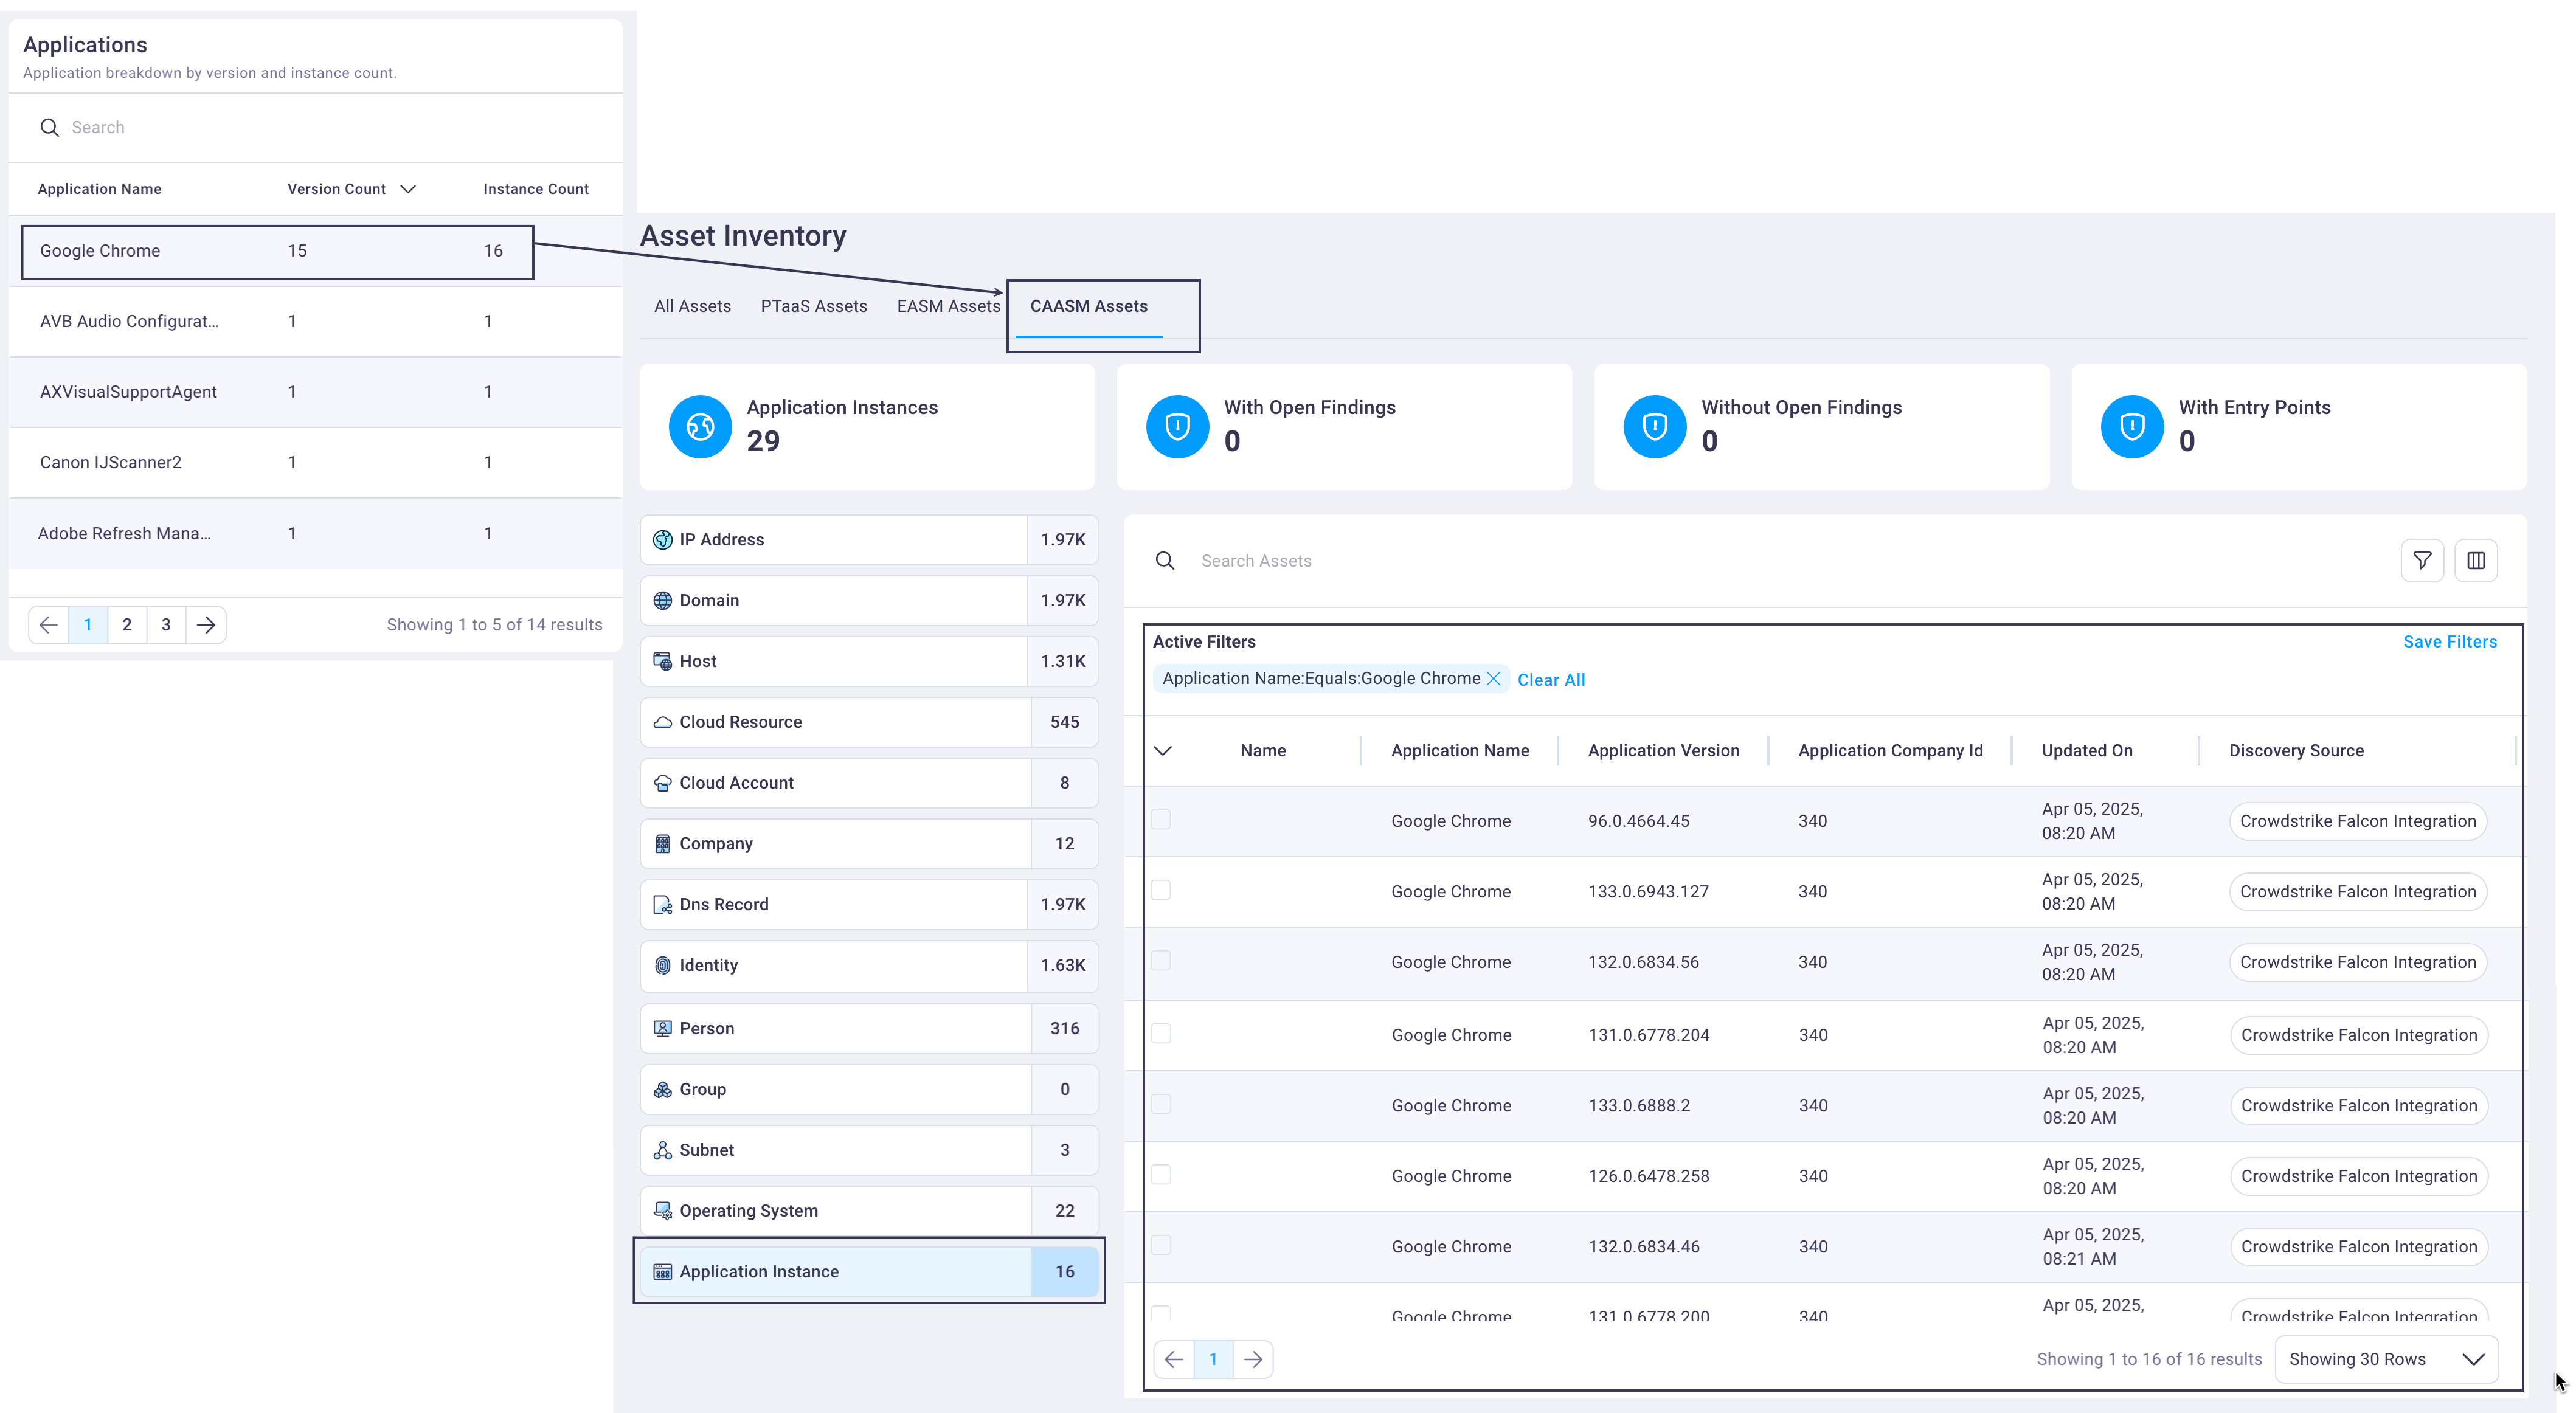
Select any row in the Applications table to display the CAASM assets table, filtered to show CAASM-discovered applications.
Selecting any asset row displays its Asset details page.
#
Operating system assets
The Operating Systems table's default display shows the operating system with the highest version count first. This alerts you to the number of different versions your organization has of any operation system, some of which may be out of date, etc.
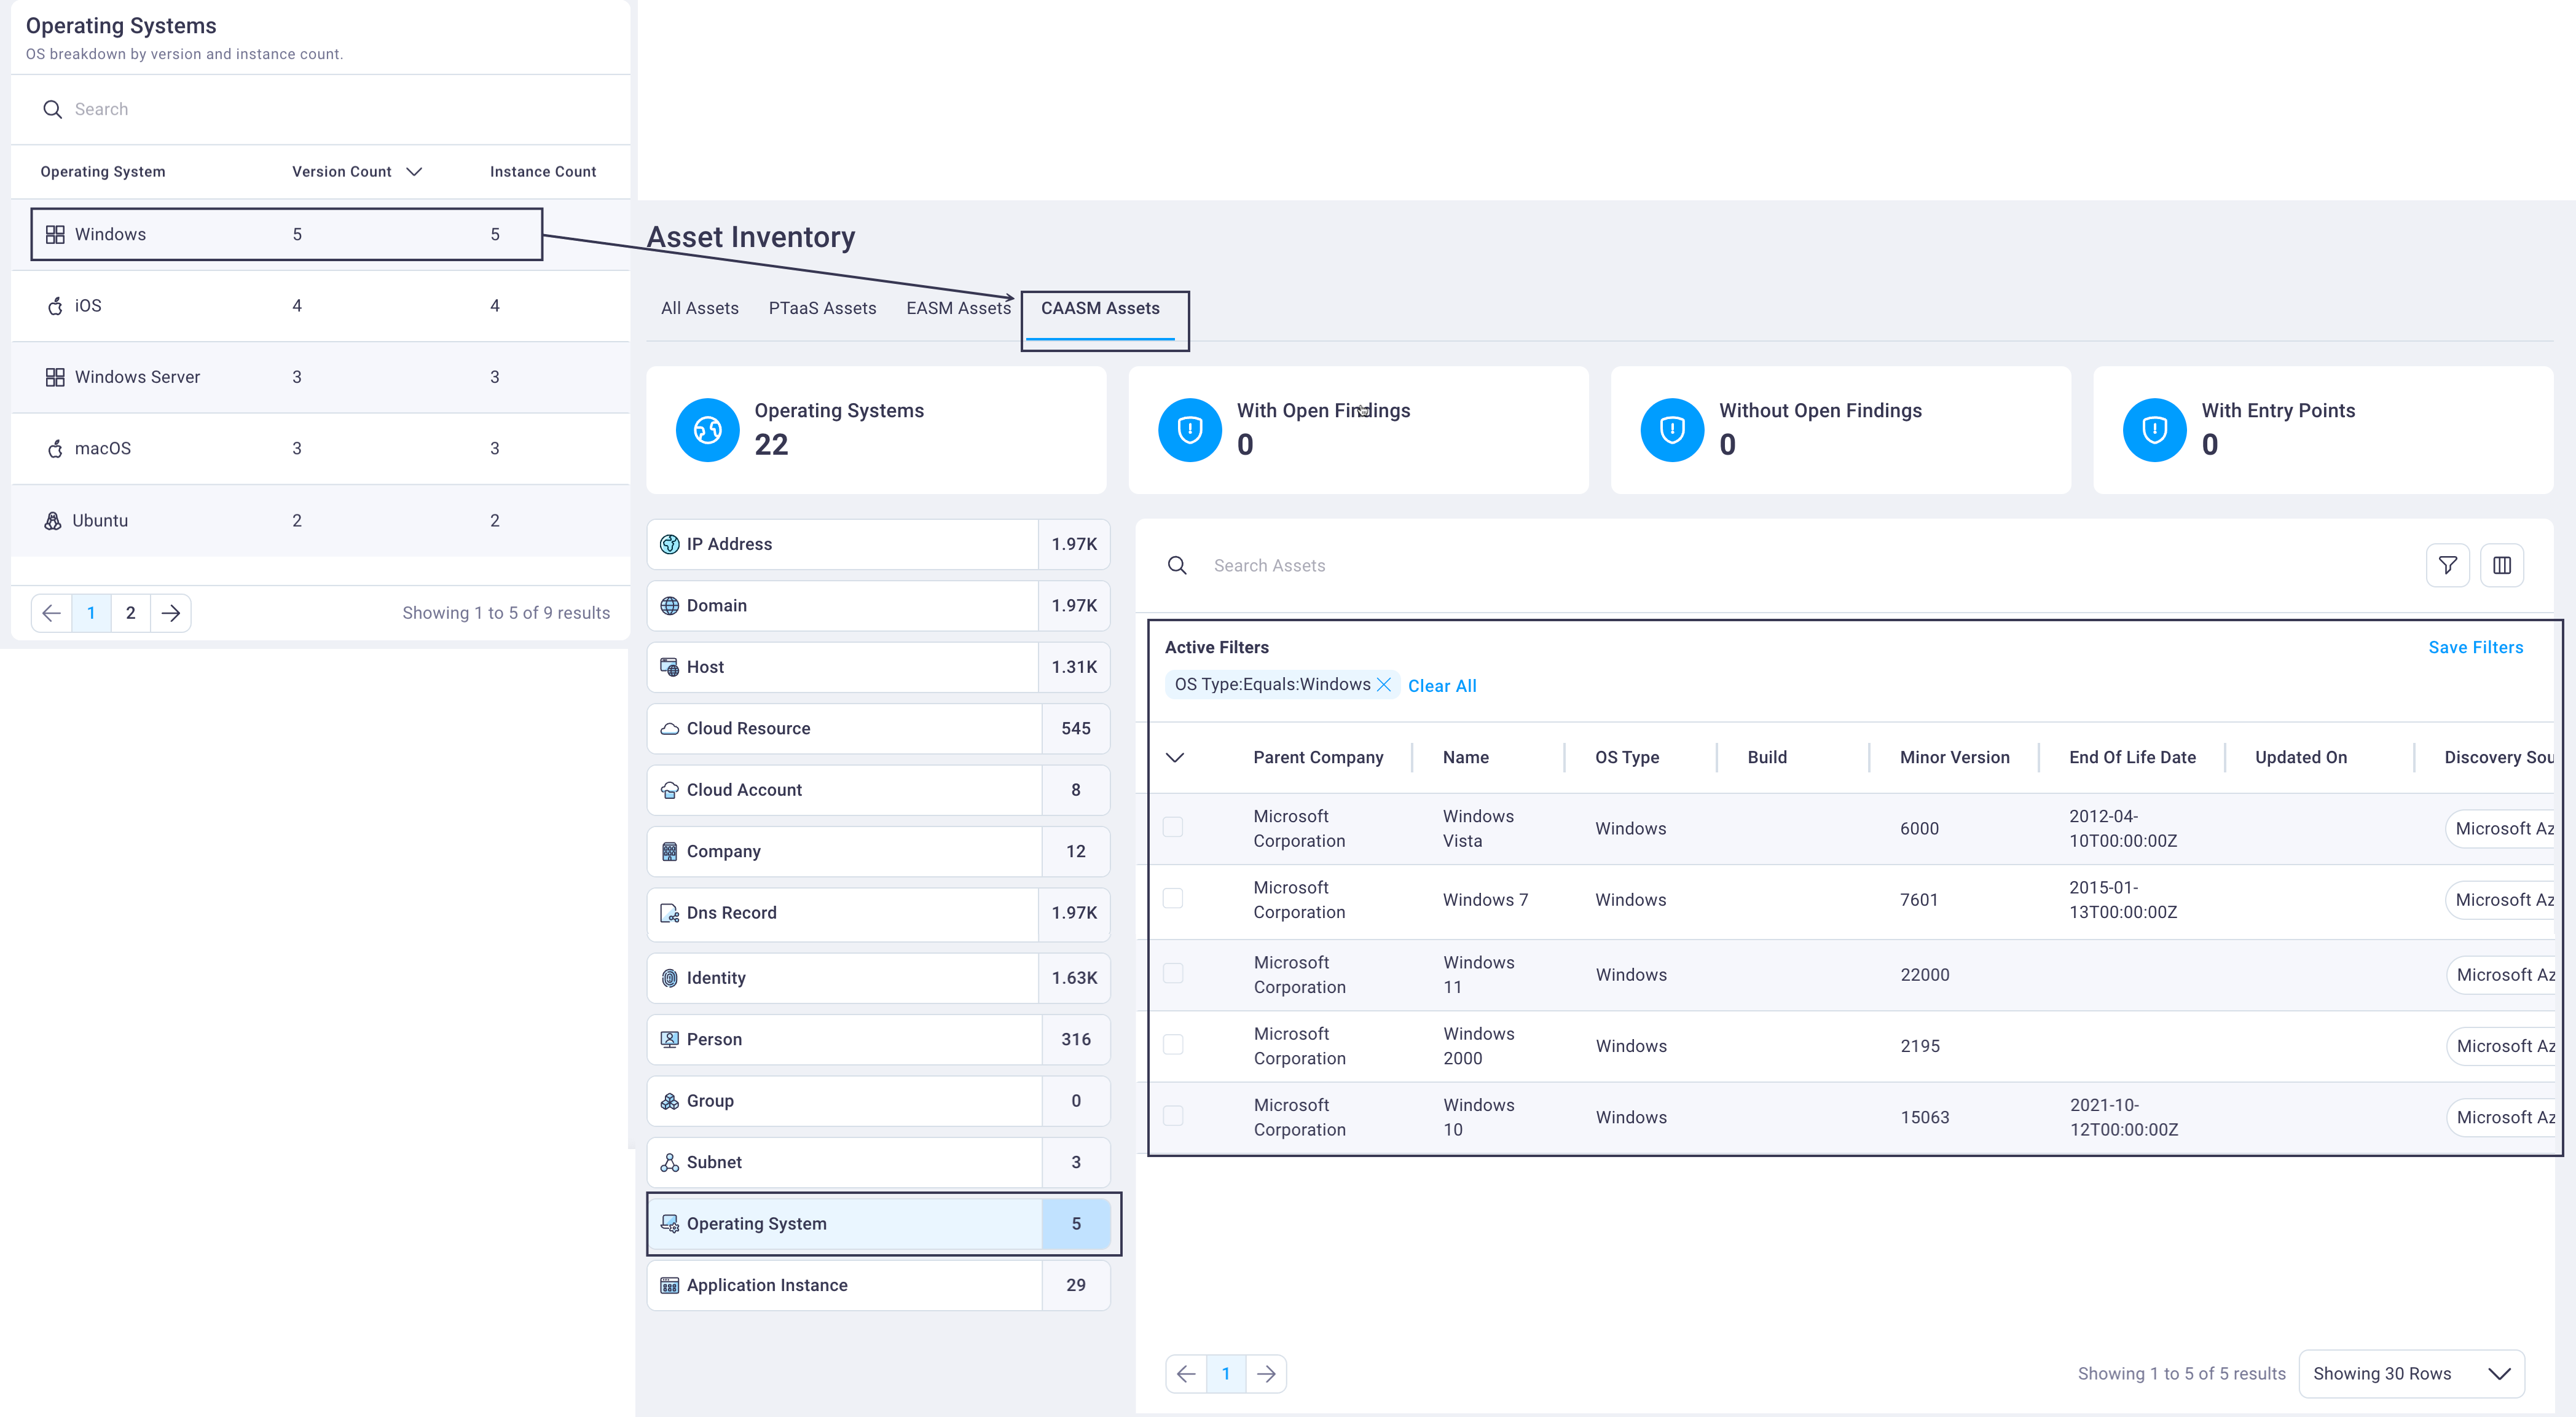
Select any row in the Operating Systems table to display the CAASM assets table, filtered to show CAASM-discovered operating systems for your organization.
Selecting any asset row displays its Asset details page.
#
Cloud resources assets
The Cloud Resources table's default display is to show the cloud resource with the highest instance count first. This alerts you to the cloud resources with the highest potential vulnerability.
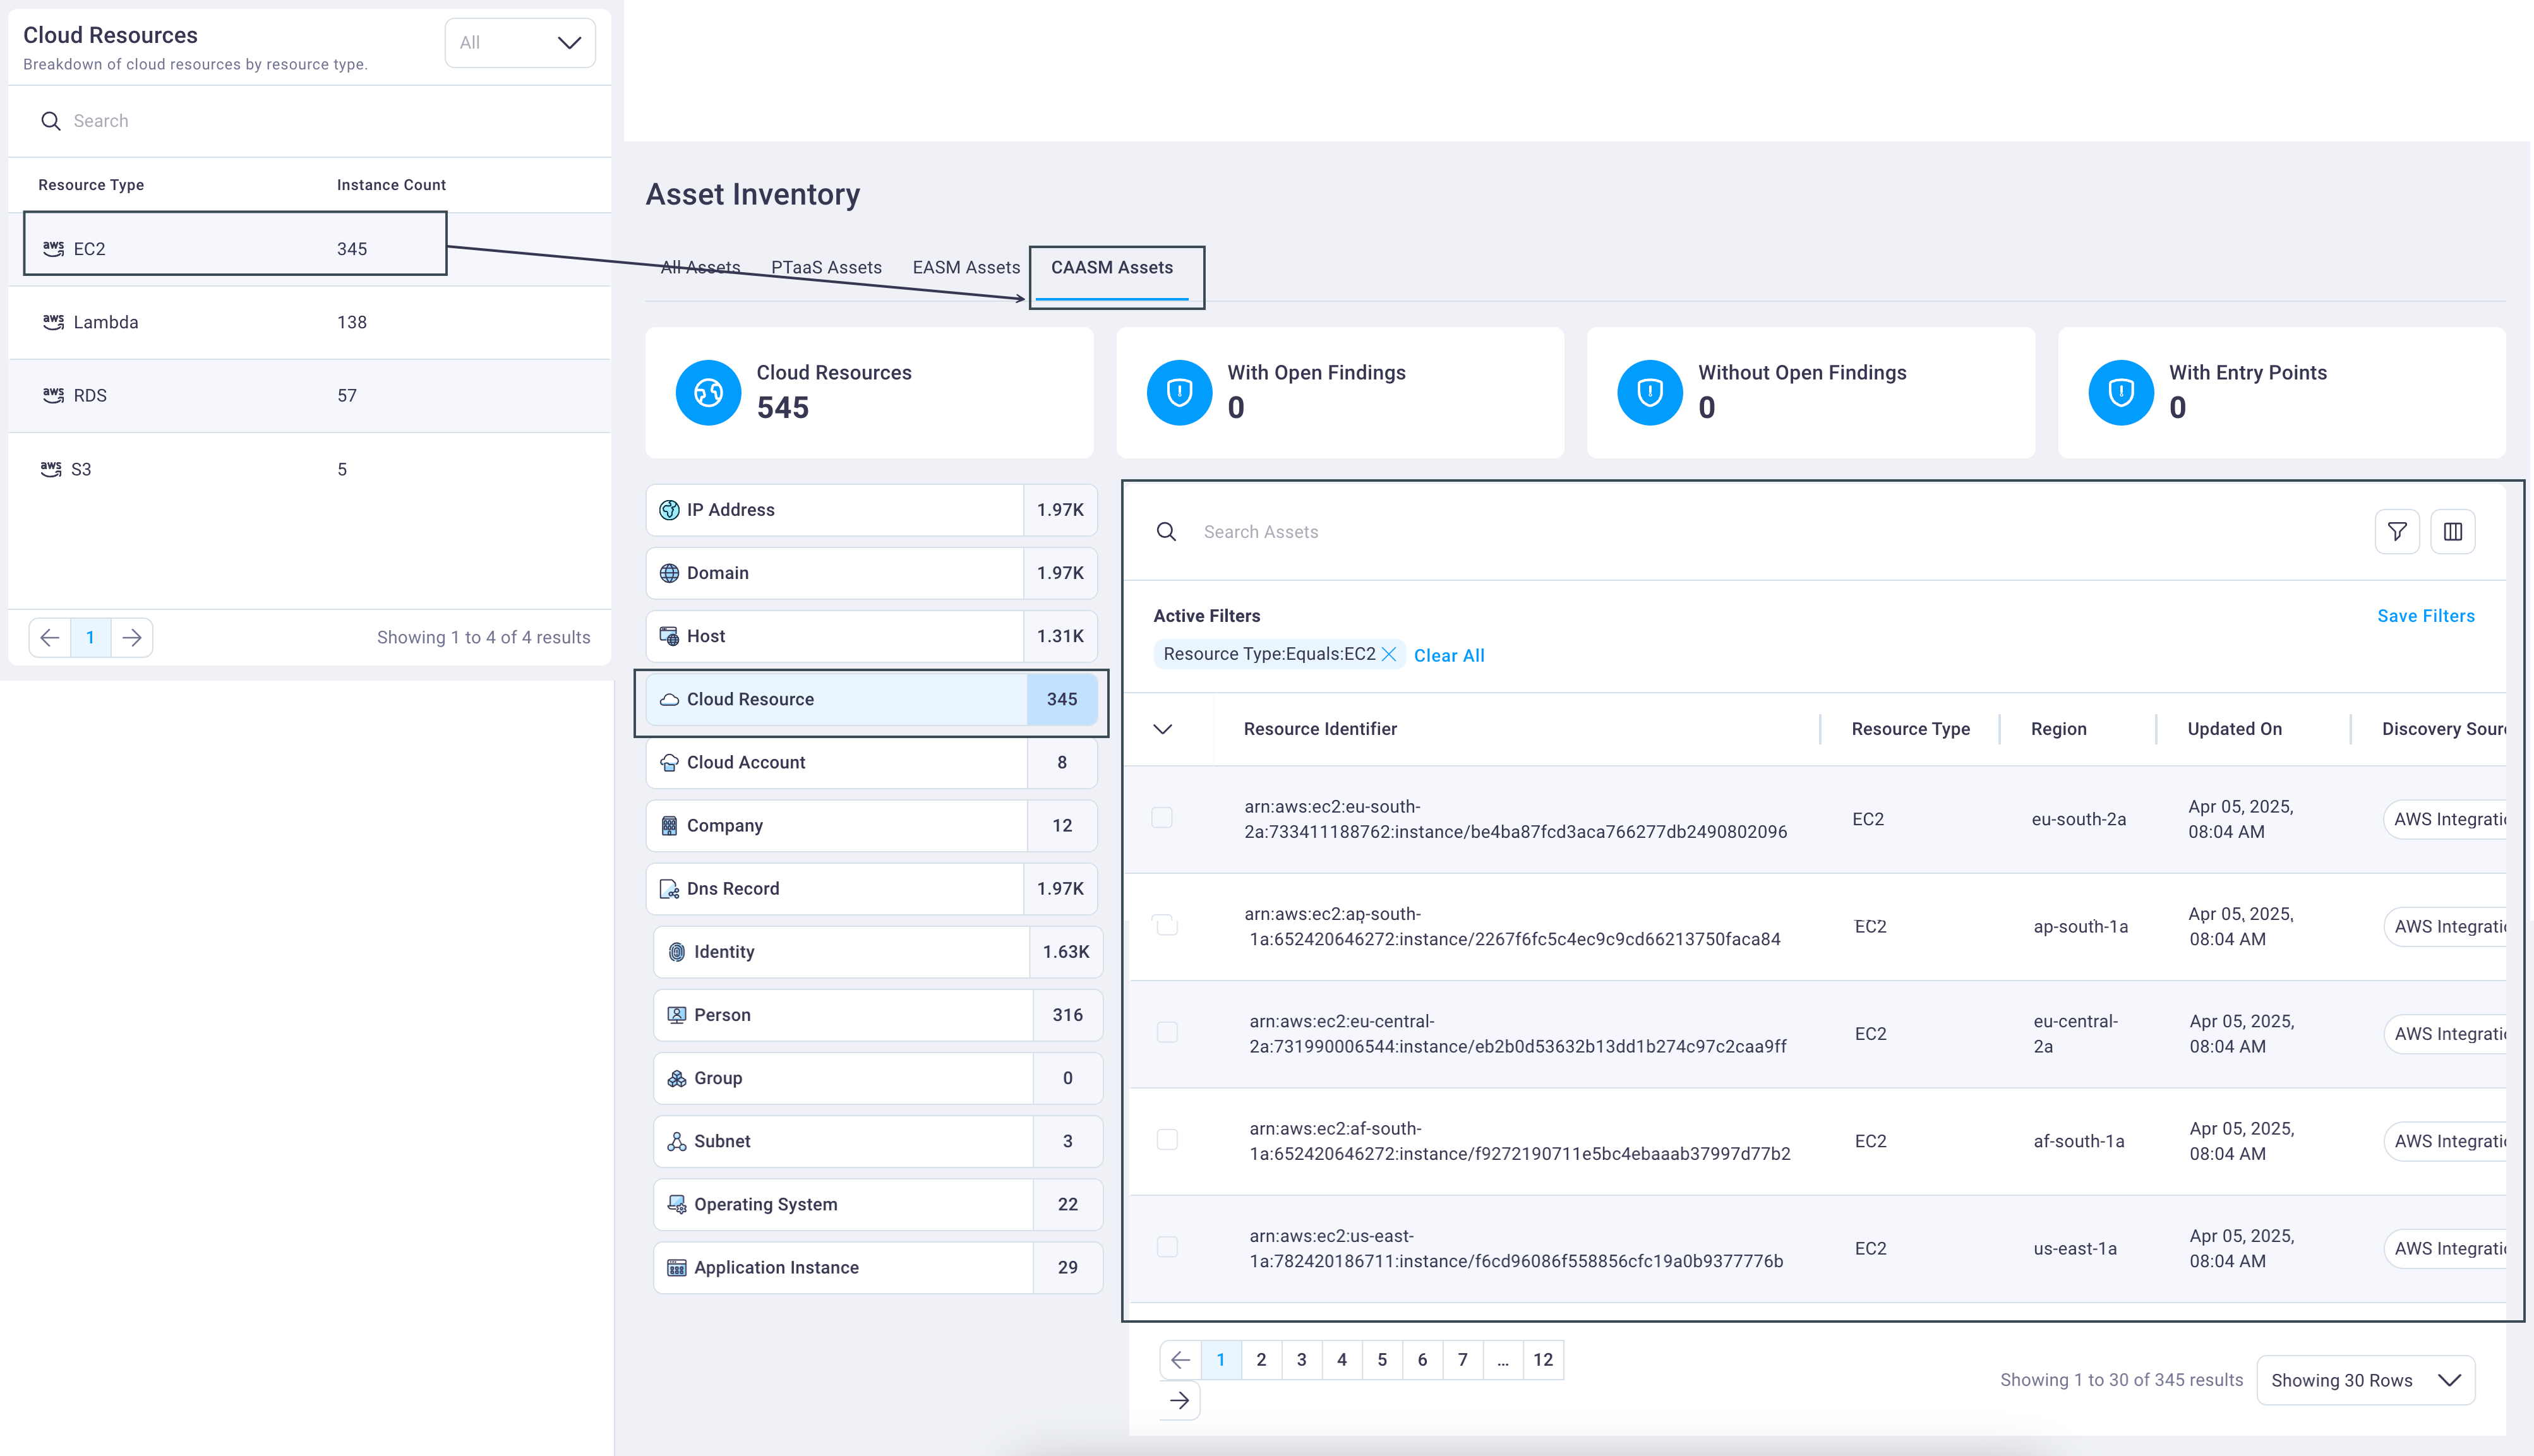
Select any row in the Cloud Resources table to display the CAASM assets table, filtered to show CAASM-discovered cloud resources for your organization.
Selecting any asset row displays its Asset details page.
#
3. Top 10 highest severity assets
The Top 10 Highest Severity Assets table displays the top-10 CAASM-discovered assets that are causing the most risk in your environment.
Selecting any of these assets pivots to the asset's details where you gain an understanding of the vulnerabilities that live on that asset. From there, you can either remediate any vulnerabilities or completely take that host offline if it's creating too much risk.

The top 10 asset status is determined by the following vulnerability-level severity statuses in this order:
- Urgent
- Critical
- High
- Medium
The number of findings associated with each asset displays to the far right in the Finding Count column.
Selecting any asset row in the Top 10 Highest Severity Assets table displays that asset's Asset details page as illustrated below.

If there is more than one asset of the same type, the Asset details page lists (and links to) the other asset(s) on the Related Assets tab.
The Top 10 Highest Severity Assets information surfaces vulnerability data directly from your CAASM integration. See the CAASM Integrations section to find out how to add an integration.
#
4. Top 10 highest severity findings
The Top 10 Highest Severity Findings table focuses on the top vulnerabilities so you gain an understanding of those vulnerabilities' breadth across the environment. Then you can develop a remediation plan.
The top-10 severe findings are associated with your CAASM-discovered assets. They are determined by the following finding severity statuses in this order:
- Urgent
- Critical
- High
- Medium

Selecting any row in the Top 10 Highest Severity Findings table displays the CAASM Findings page filtered to show the top 10 findings.

Selecting any finding row in the CAASM Findings table displays the full details for that finding on its Finding Details page.
The To0 10 Highest Severity Findings surfaces vulnerability data directly from your CAASM integration. See the CAASM Integrations section to find out how to add an integration.
#
5. Asset visibility by integration
The Asset Visibility by Integration field group displays the percentage of your assets that are covered by each integration. Most integrations indicate you don't have 100% of your assets covered by them.

Select one of the three integration cards to quickly view details about those integrations:
- Enabled Integrations: Displays the number of integrations that are enabled and ready for use.
- Working Integrations: Displays the number of integrations that are currently working and the last time they sync'd with your integrated application.
- Failed Integrations: Displays the number of integrations that enabled but failed to sync with your integrated application on their most recent sync attempt.

Hover over any Asset Visibility by Integration card to view an explanation of what each card displays.

- If an integration fails, you can select the row in the table for that integration and begin troubleshooting it from the integration's History tab.

Some integrations represent very specific security controls. For example, CrowdStrike is an EDR solution that you install onto a endpoint, like a workstation or a laptop, that watches for malicious behavior and helps prevent and report those things. Your incident response teams can then address the malicious behavior to mitigate the damage. Most organizations want to make sure controls like CrowdStrike are on 100% of their environment.
In the Tenable example below, you can see out of 958 assets, only 10% are covered by Tenable vulnerability management's vulnerability scanner. It scans your assets, and if it's missing 90% of them, that is something you will likely want to know about and correct.

As you expand and review the Tenable integration row, you can see in this example that subnets, which is the number of networks that are included, are only 33% covered. Hovering over the Asset Visibility Breakdown line graph indicates there are two subnets currently not covered by Tenable.

From here you can ensure you get 100% coverage where it's currently lacking to so that you have the coverage you really need for both security and compliance reasons.
Expand and select any asset row in the Asset Count by Integration Type table to view it in the CAASM Assets table, as illustrated below.
