#
Attack Surface dashboard
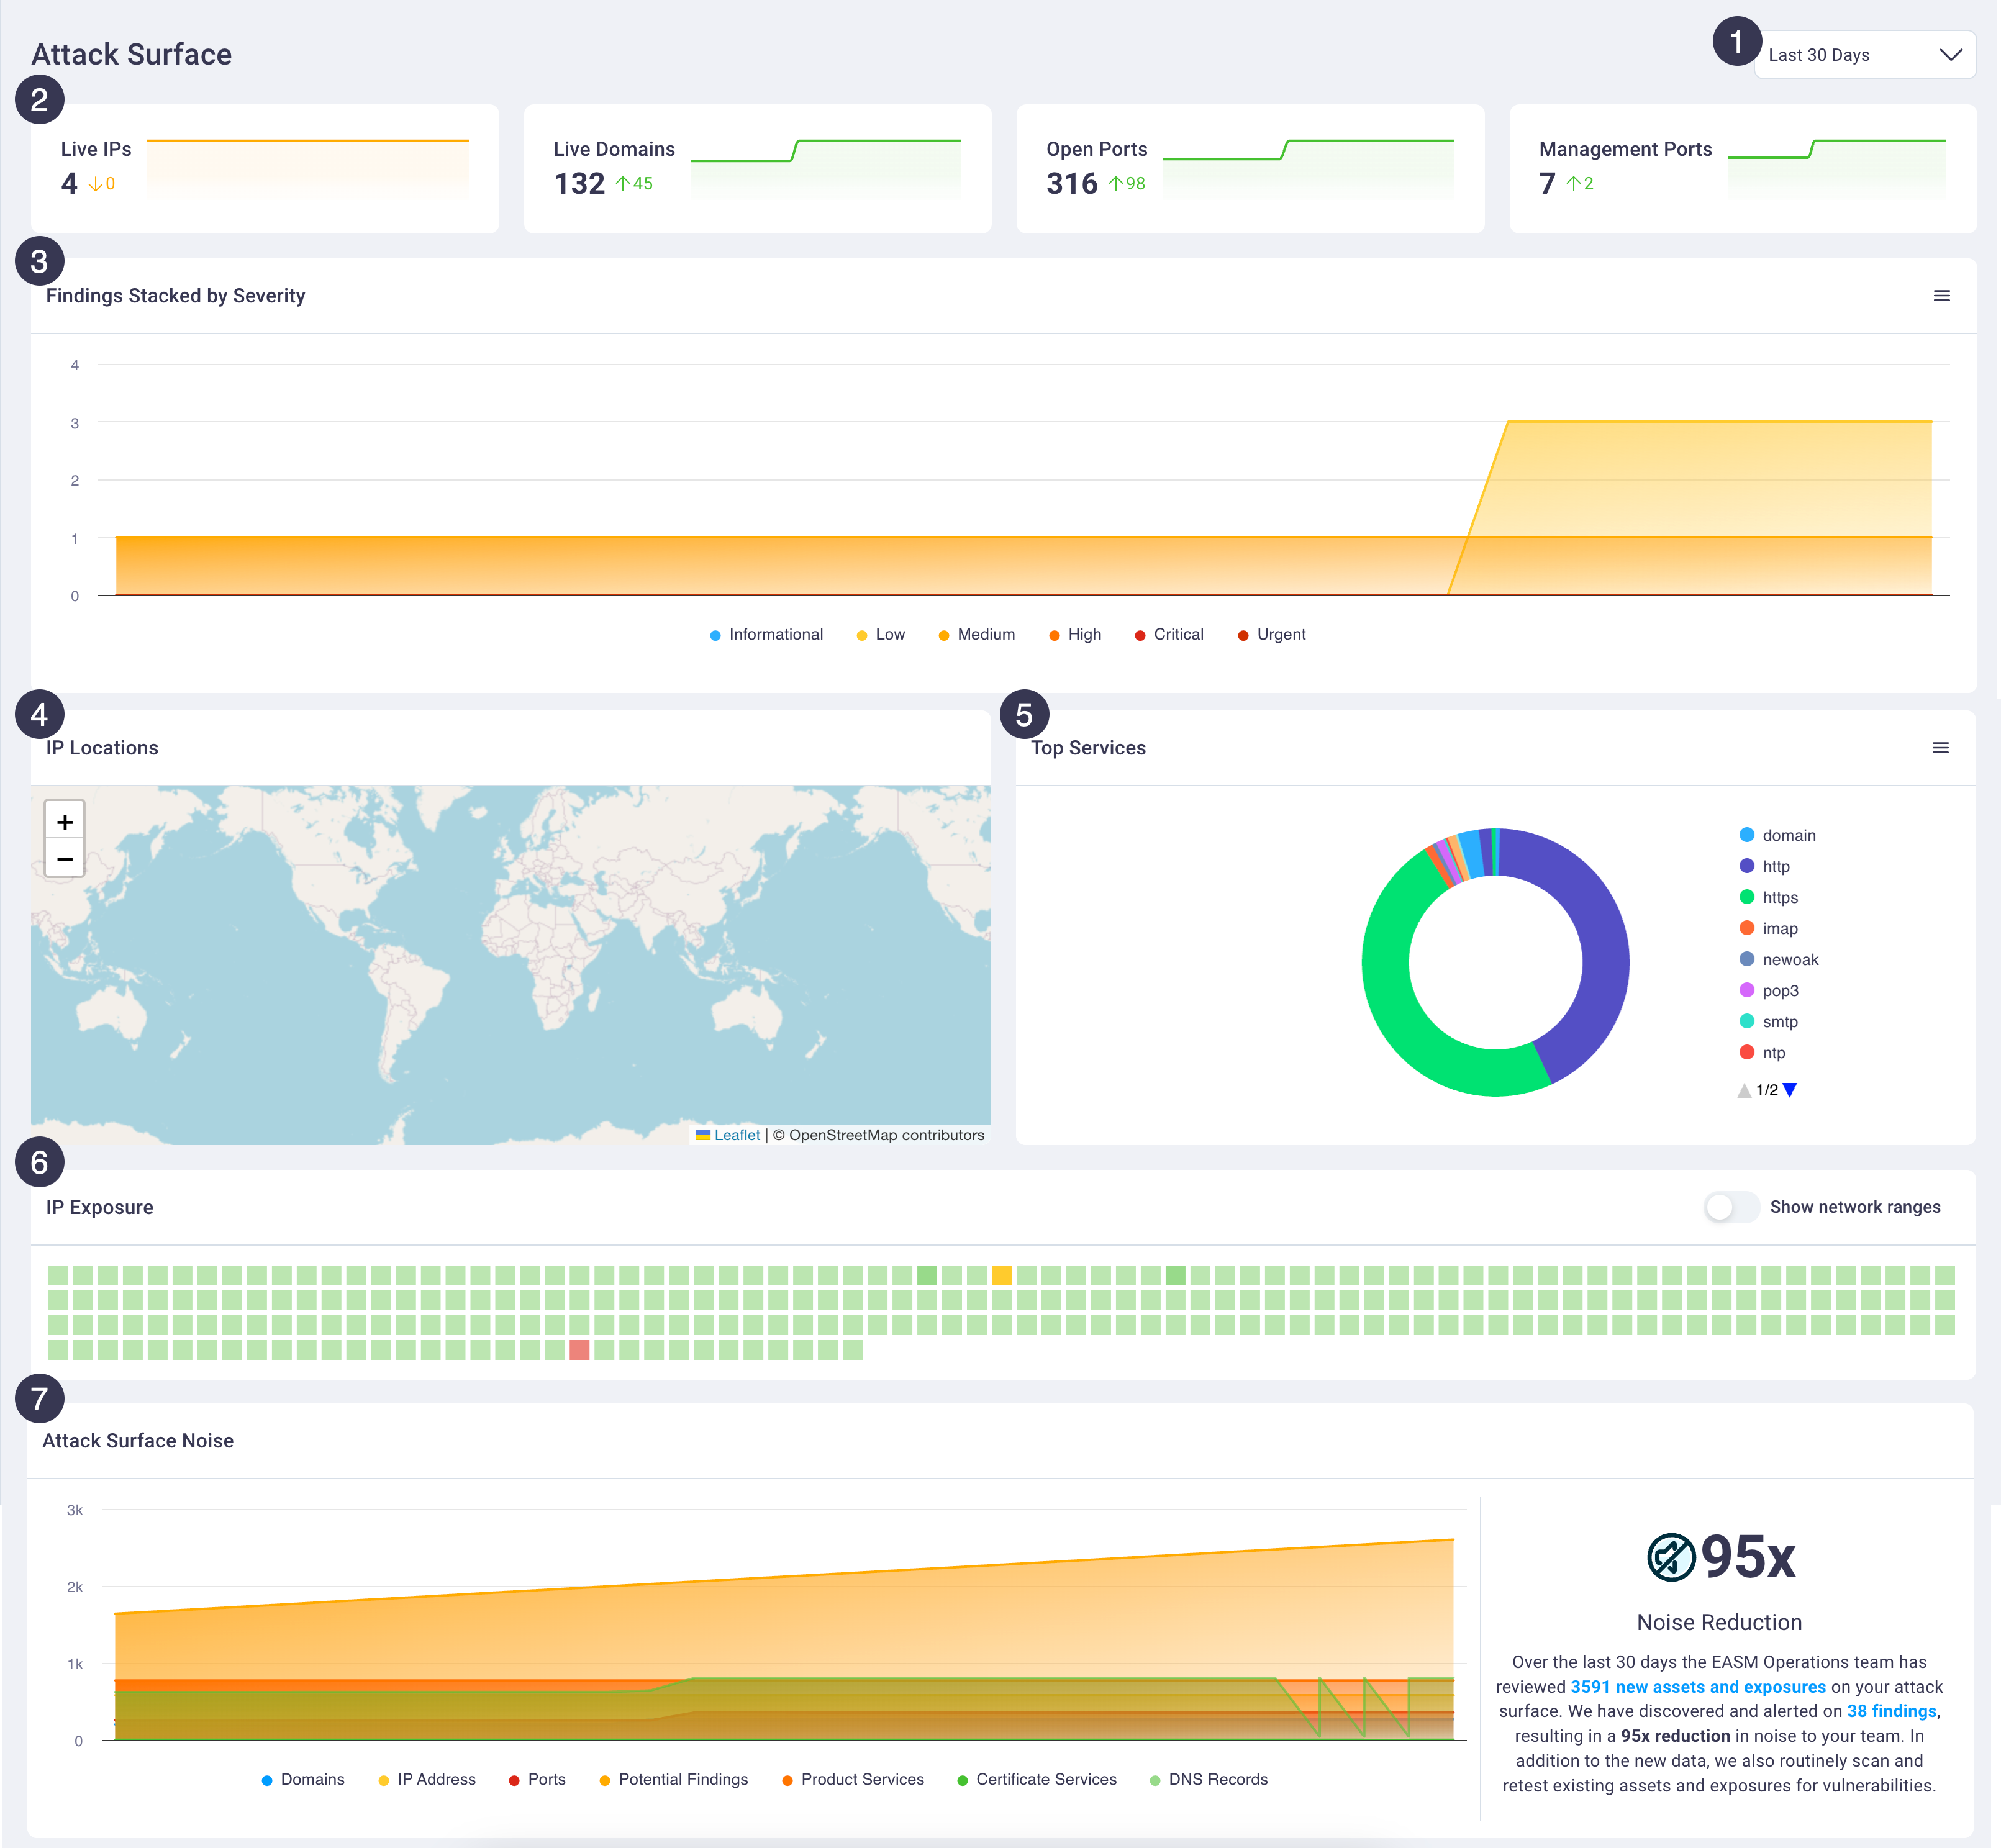
The Attack Surface dashboard displays information card summaries of live IPs and domains and ports that are open and active in management along with interactive charts related to EASM findings, IP locations and exposure and attack surface noise.
#
Attack Surface dashboard overview
The table below provides a high level description of available actions on this dashboard, followed in more detail in the sections below it.
#
1. Date range control
Select the number of days prior to the current date for which you'd like to review attack surface data.
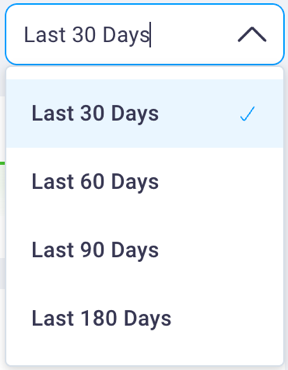
The number of day options include: 30, 60, 90, and 180. Your selection affects the info cards and all charts and graphs on the page.
#
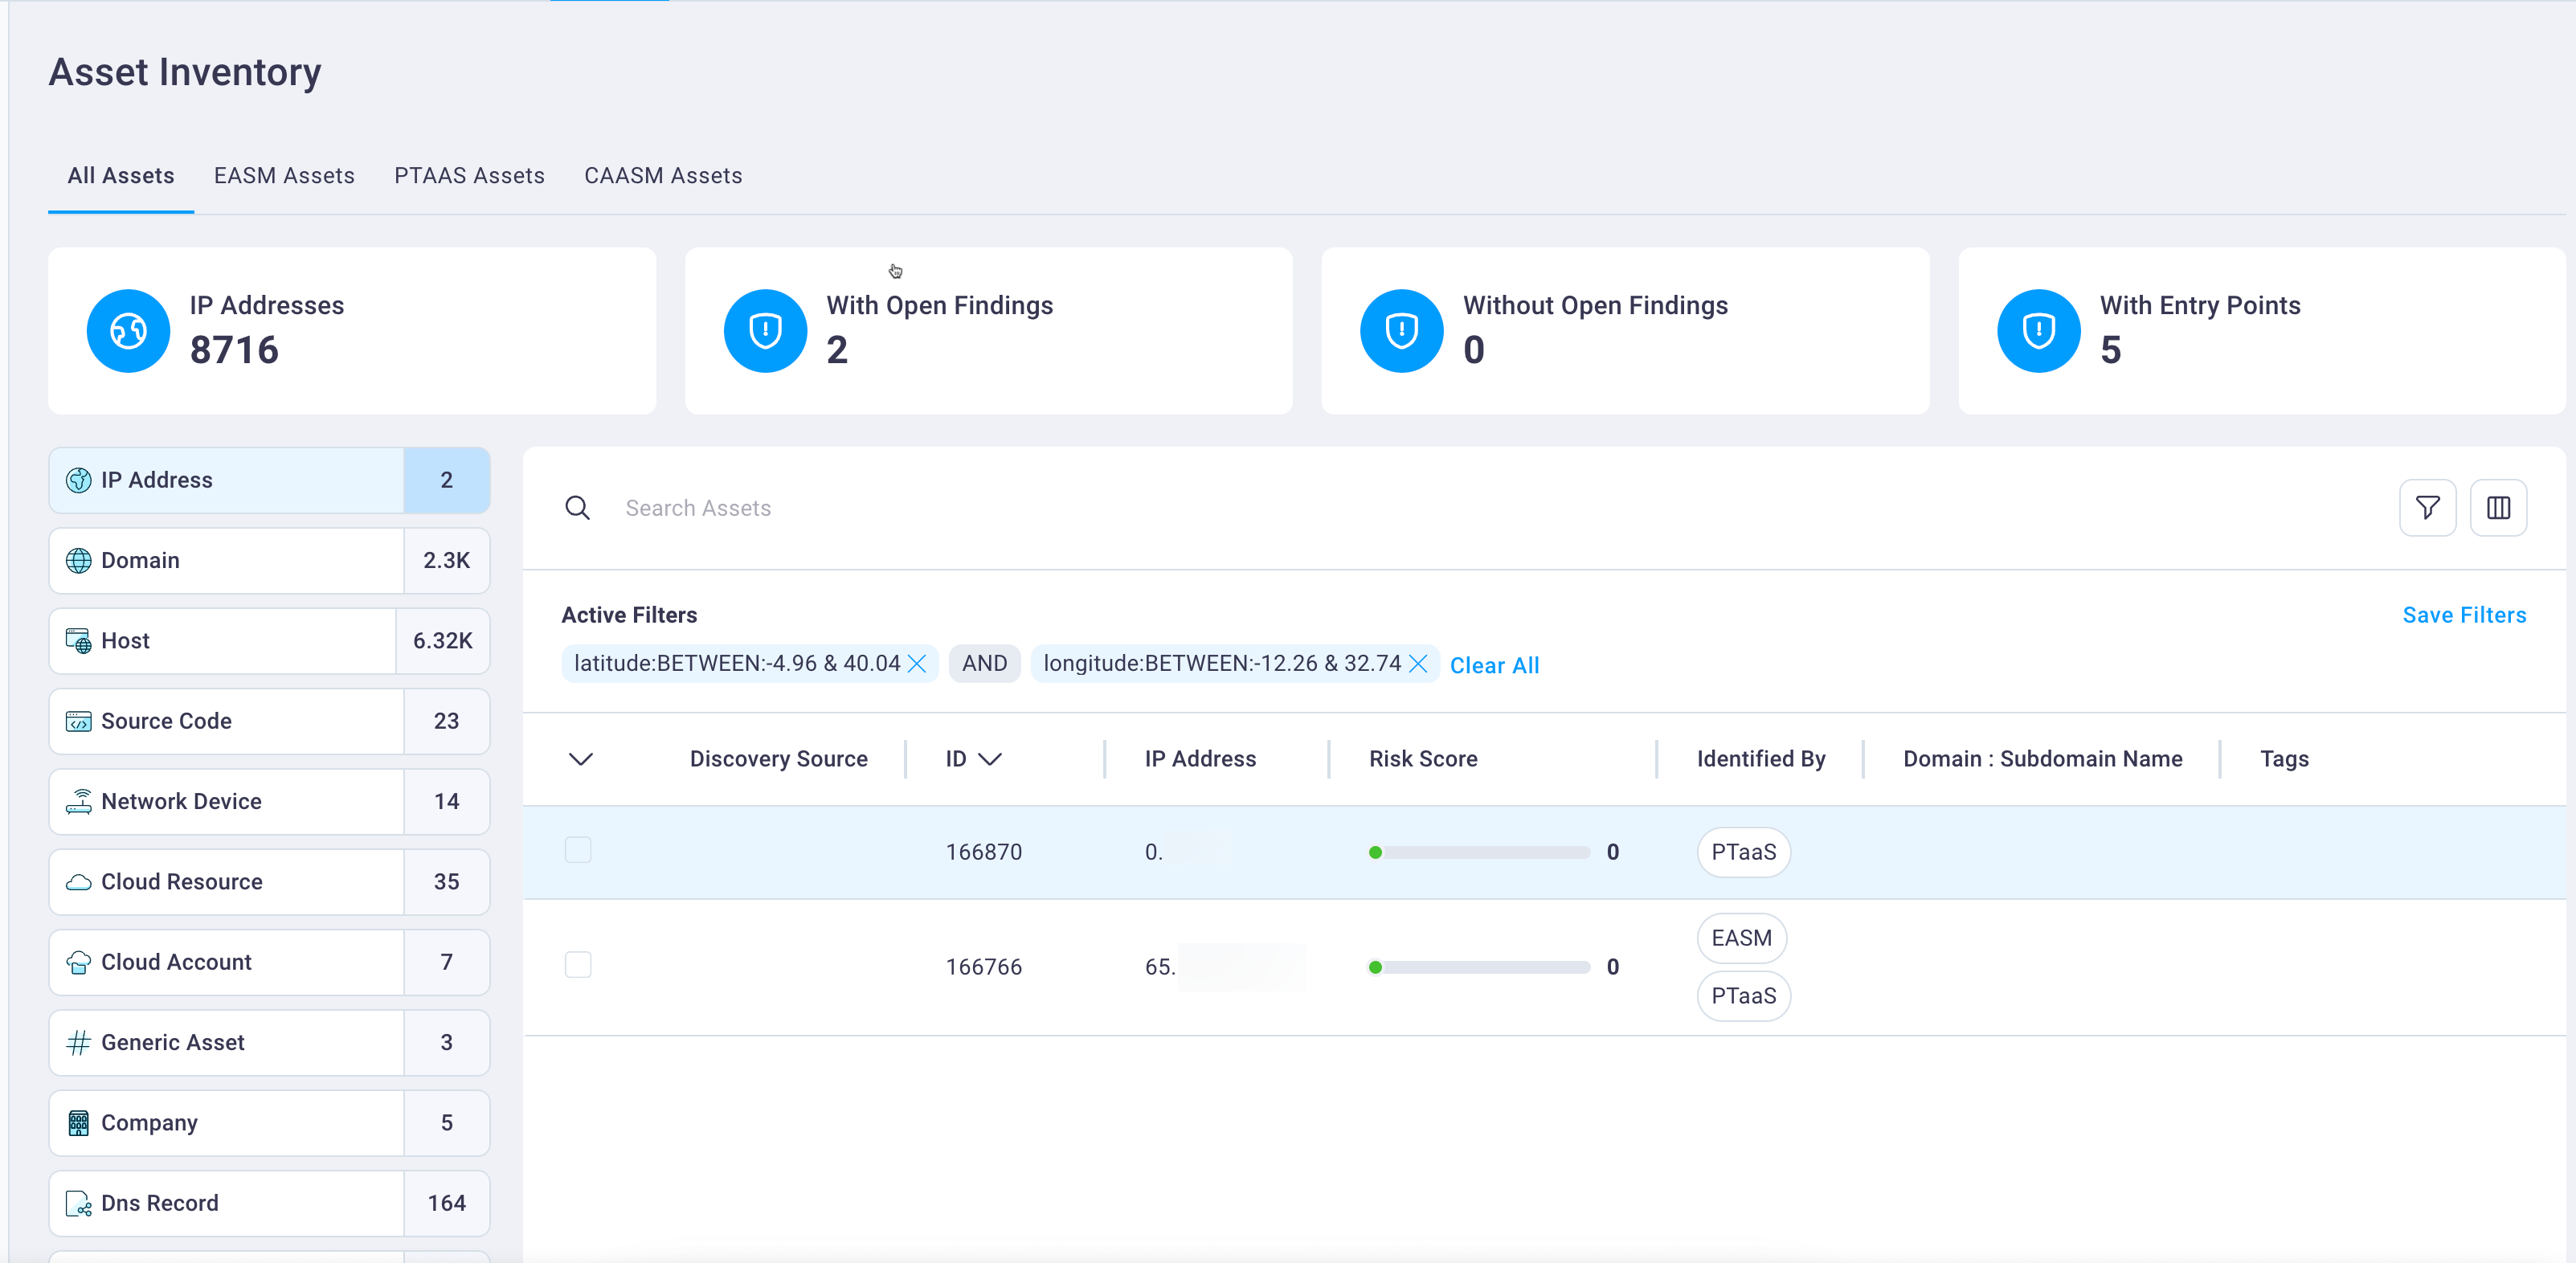
2. Information cards
The info cards display a high level count of IP, domain, and port information.
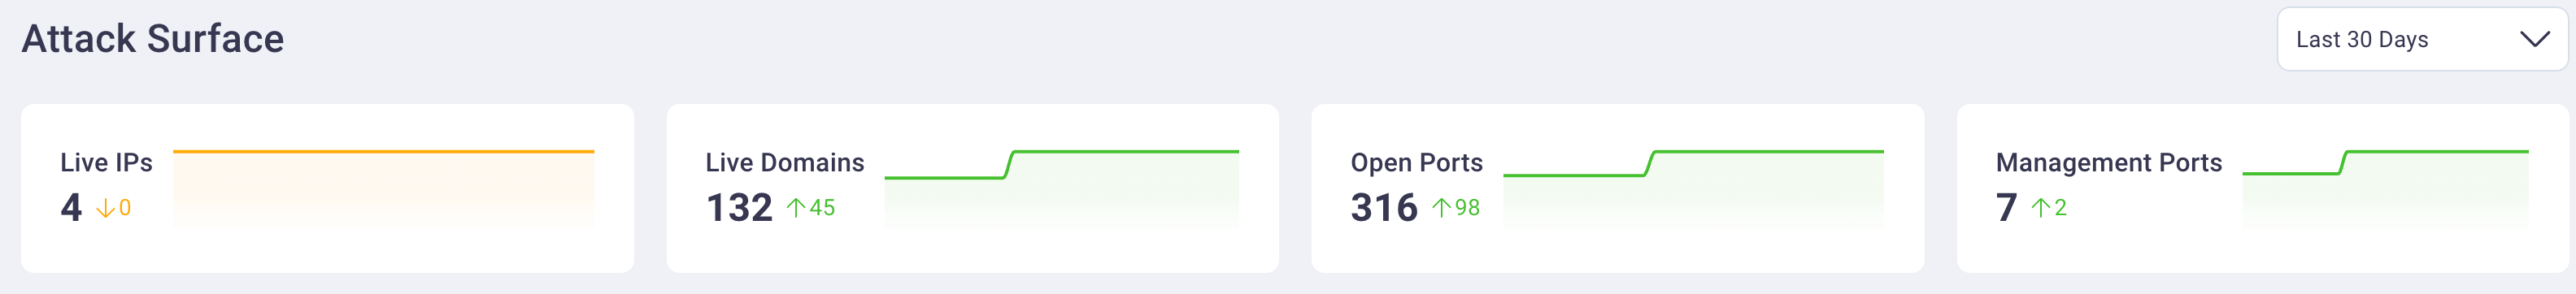
Selecting any of the cards puts focus on the page for that asset with the table's data filtered to match the selected card.
For example, selecting the Live IPs card displays the EASM Assets page with the IP Address asset type selected and the table data filtered to match the dashboard's selections.
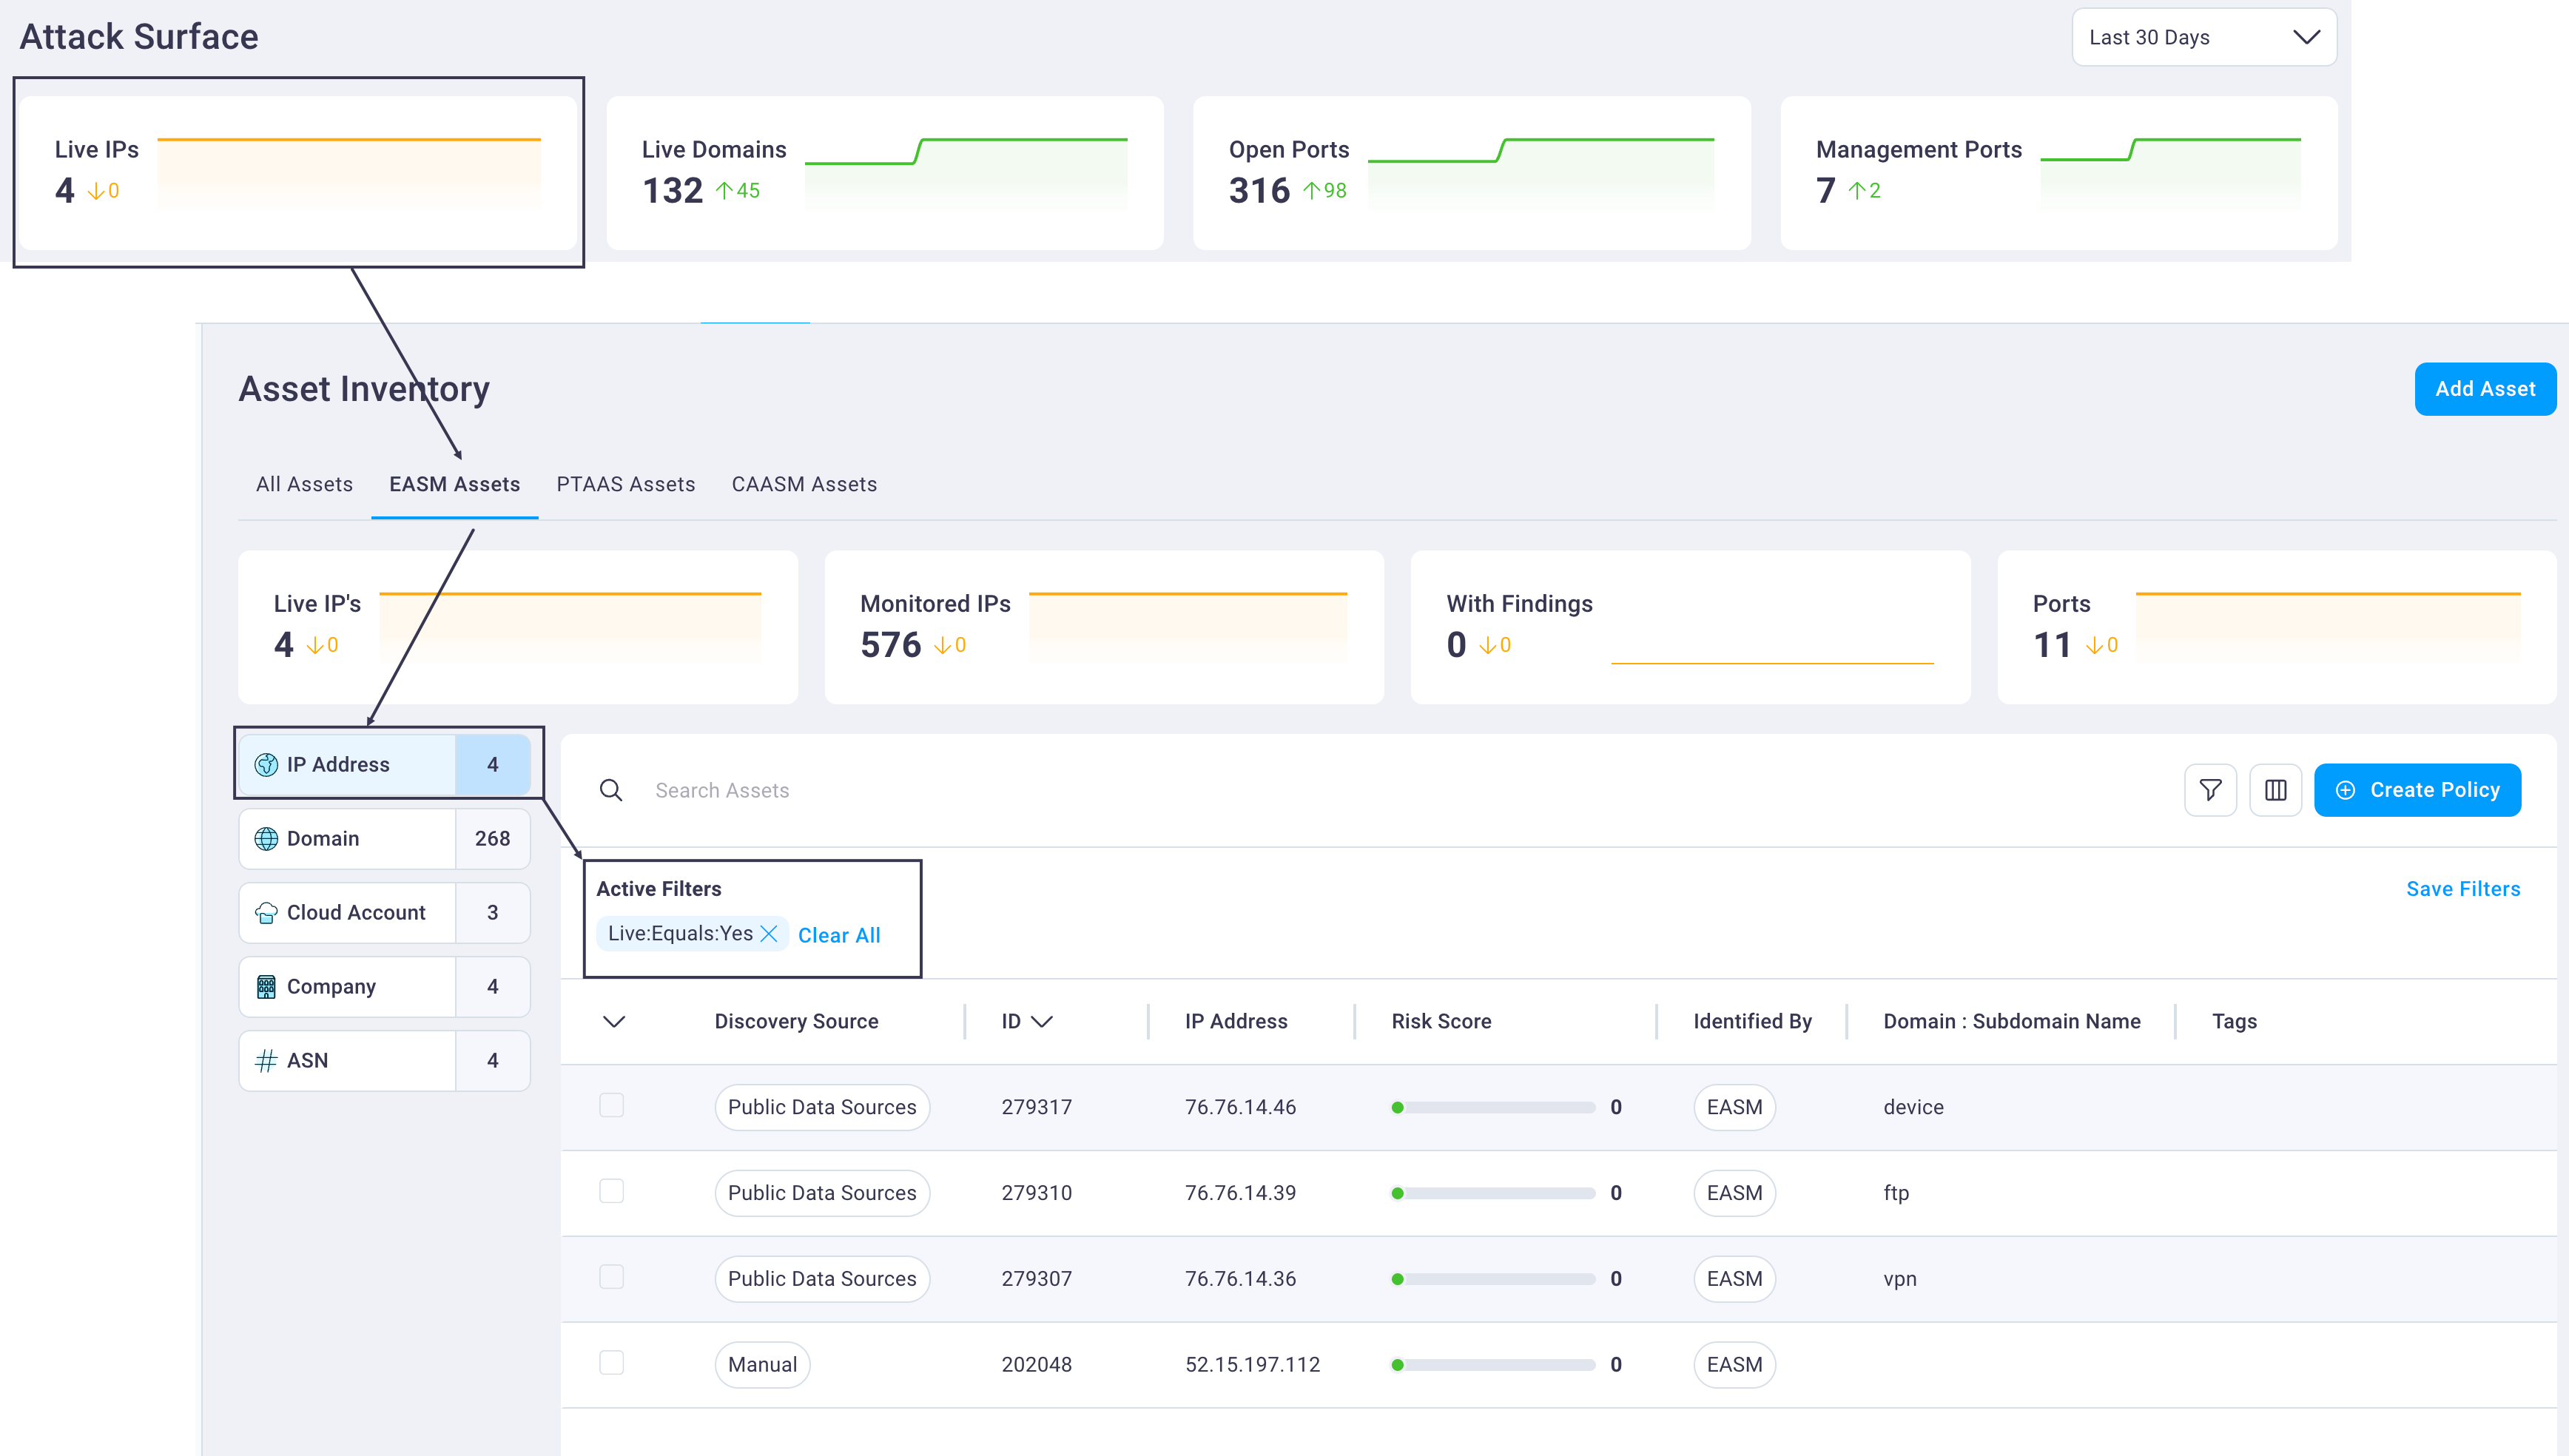
Selecting the Live Domains info card displays the EASM Assets page with the Domain asset type selected and the table data filtered to match the dashboard's selections.
See the Assets page for more information.
Selecting the Open Ports info card displays the EASM Ports page with the Ports table filtered to display all open ports.
Selecting the Management Ports info card displays the EASM Ports page with the Ports table filtered to display all Management ports.
See the Ports page for more information.
#
3. Findings Stacked by Severity chart
The Findings Stacked by Severity chart displays an interactive chart that allows you to view the count of findings for each severity level.
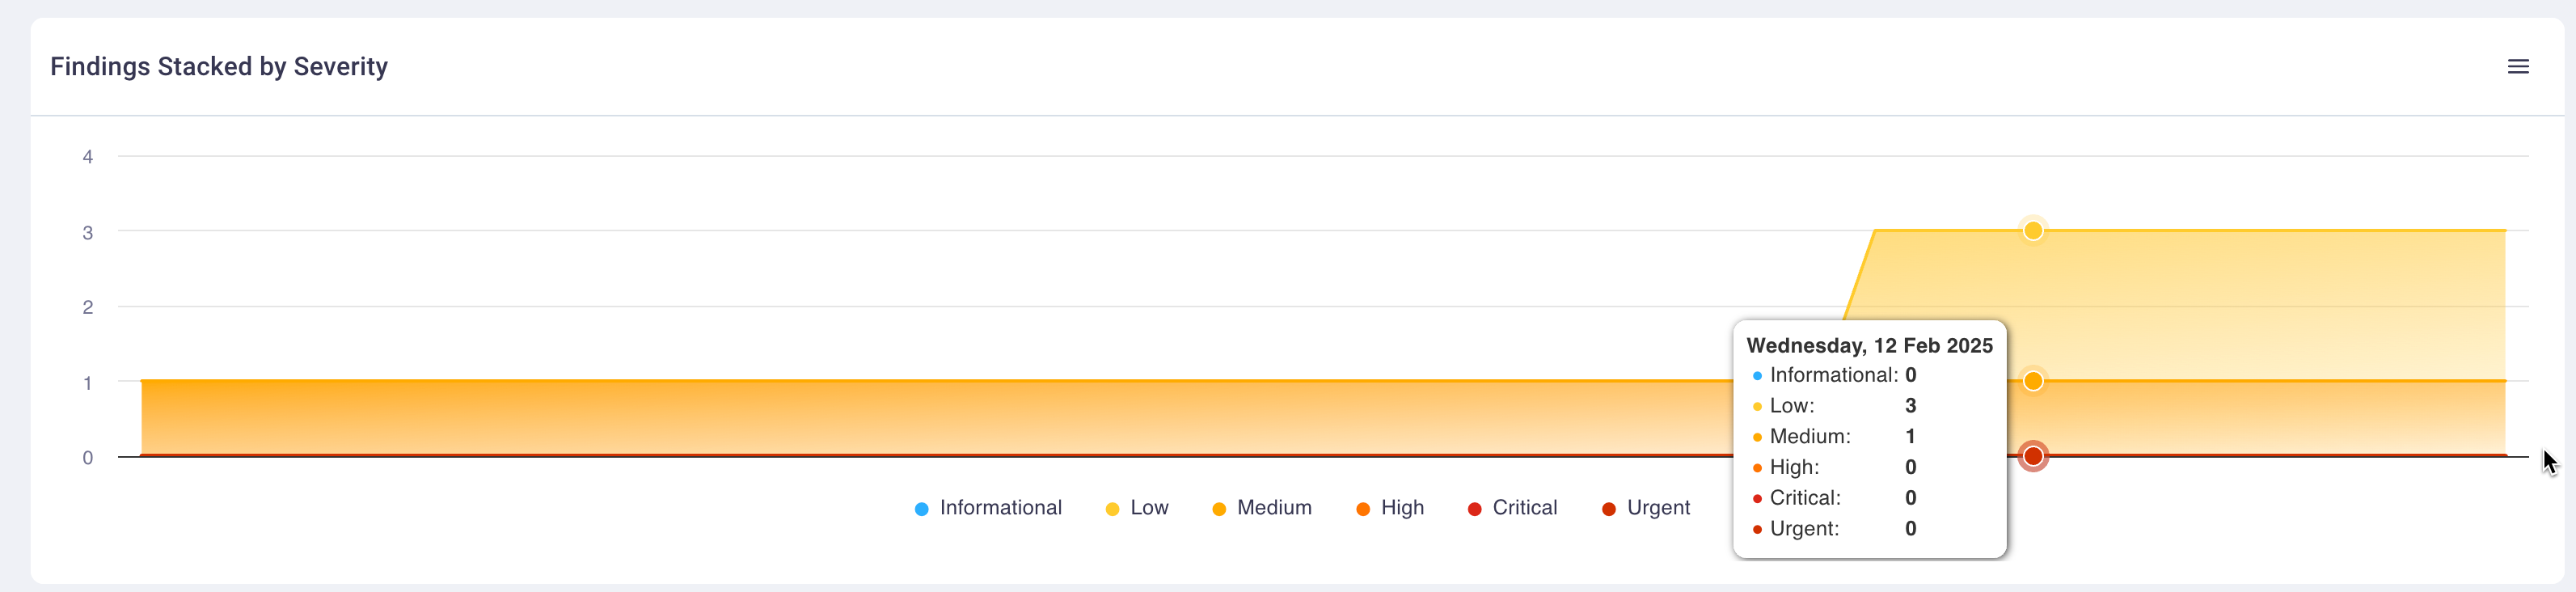
Hover over the chart to view the number of findings by severity for that date. Selecting any of the data points puts focus on the Findings page with the Findings table filtered to your selection from the chart.
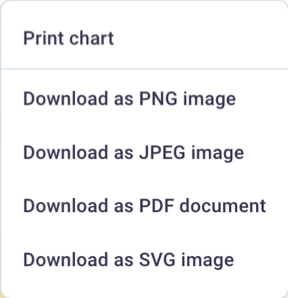
Select the hamburger menu icon for the chart to print the chart or download it in the following format options: PNG, JPEG, PDF, or SVG.
See the Findings page for more information.
#
4. IP Locations map
The IP Locations map provides a geographic display of your organization's IPs throughout the world.
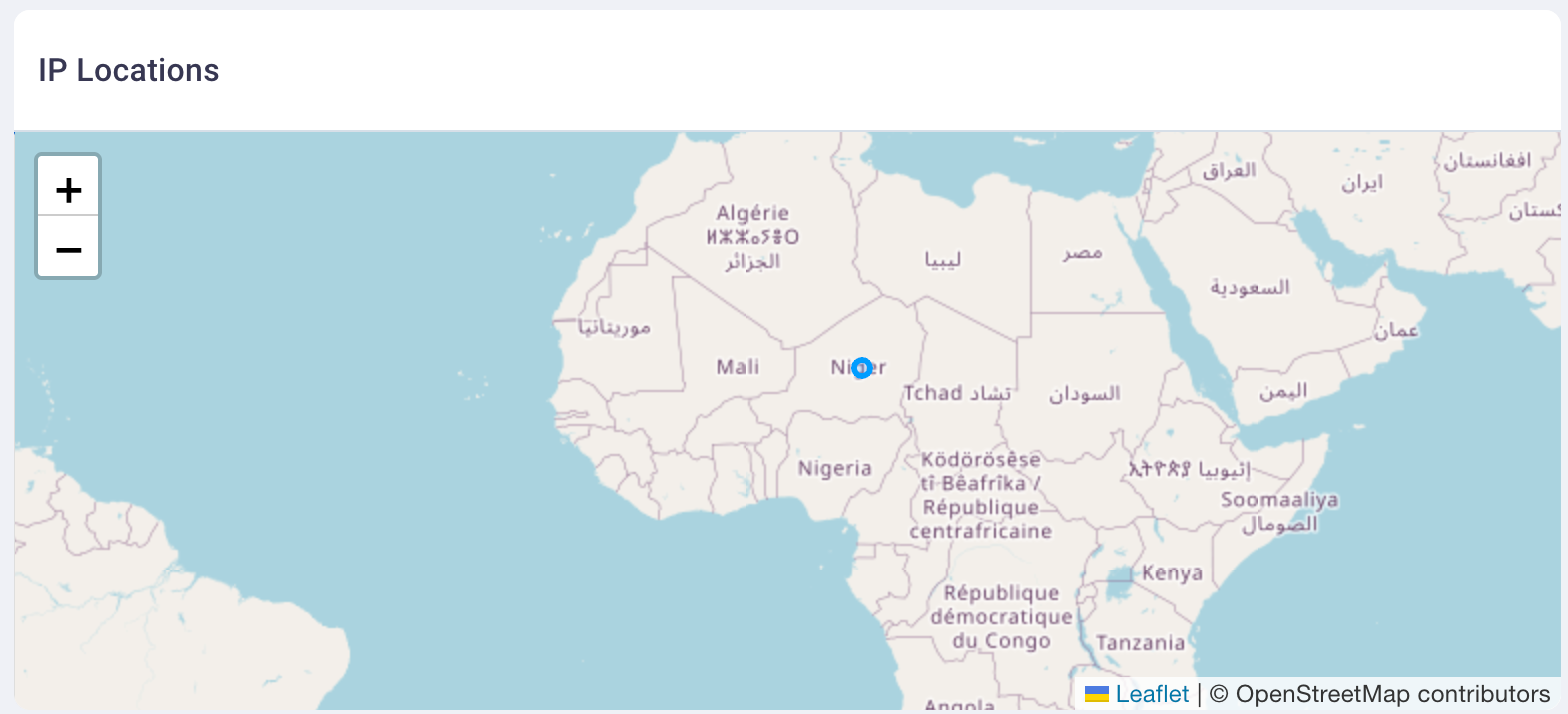
Selecting a bubble icon on the map displays the Assets page with focus on the All Assets tab, which is filtered to display the IPs in scope of the selected geographic location.
#
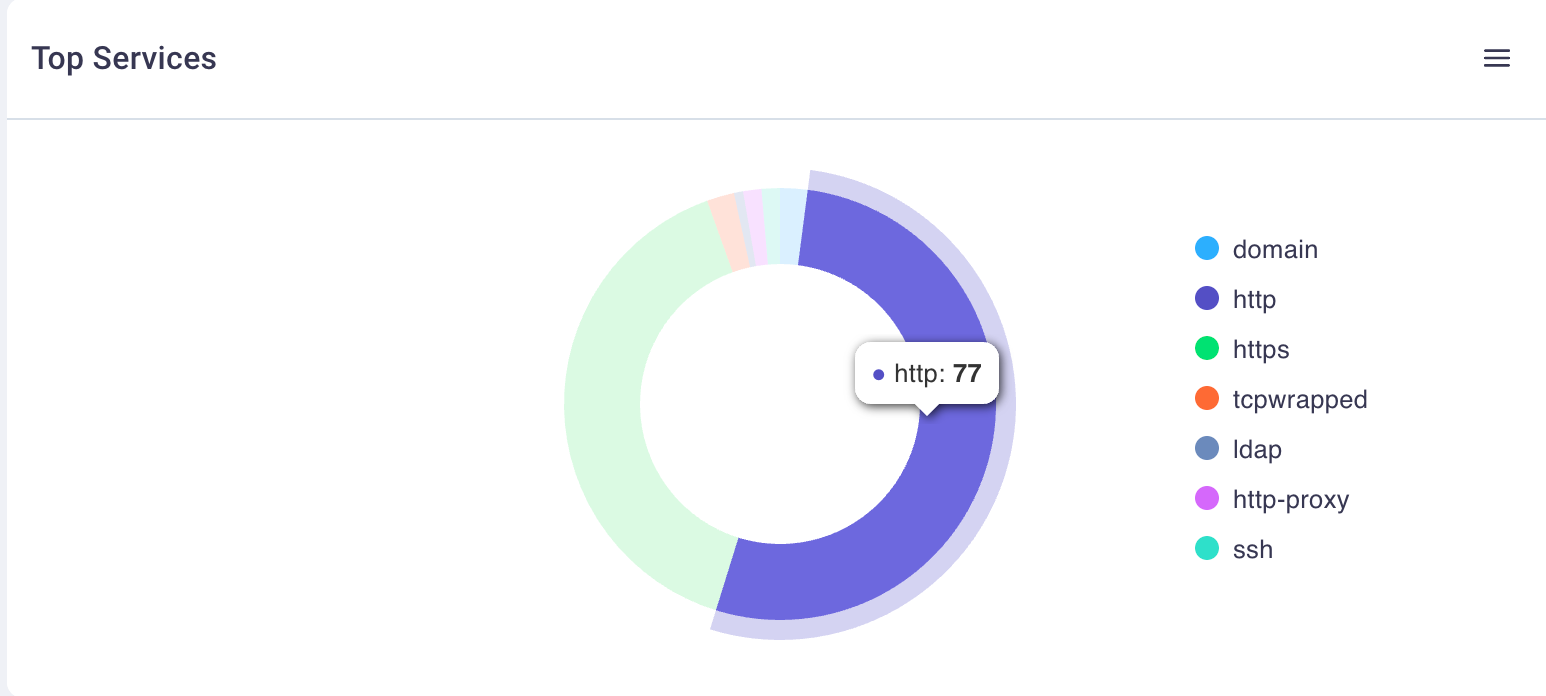
5. Top Services chart
The Top Services chart is a donut chart of the most prevalent network services in use by your organization that can be discovered on your external attack surface.
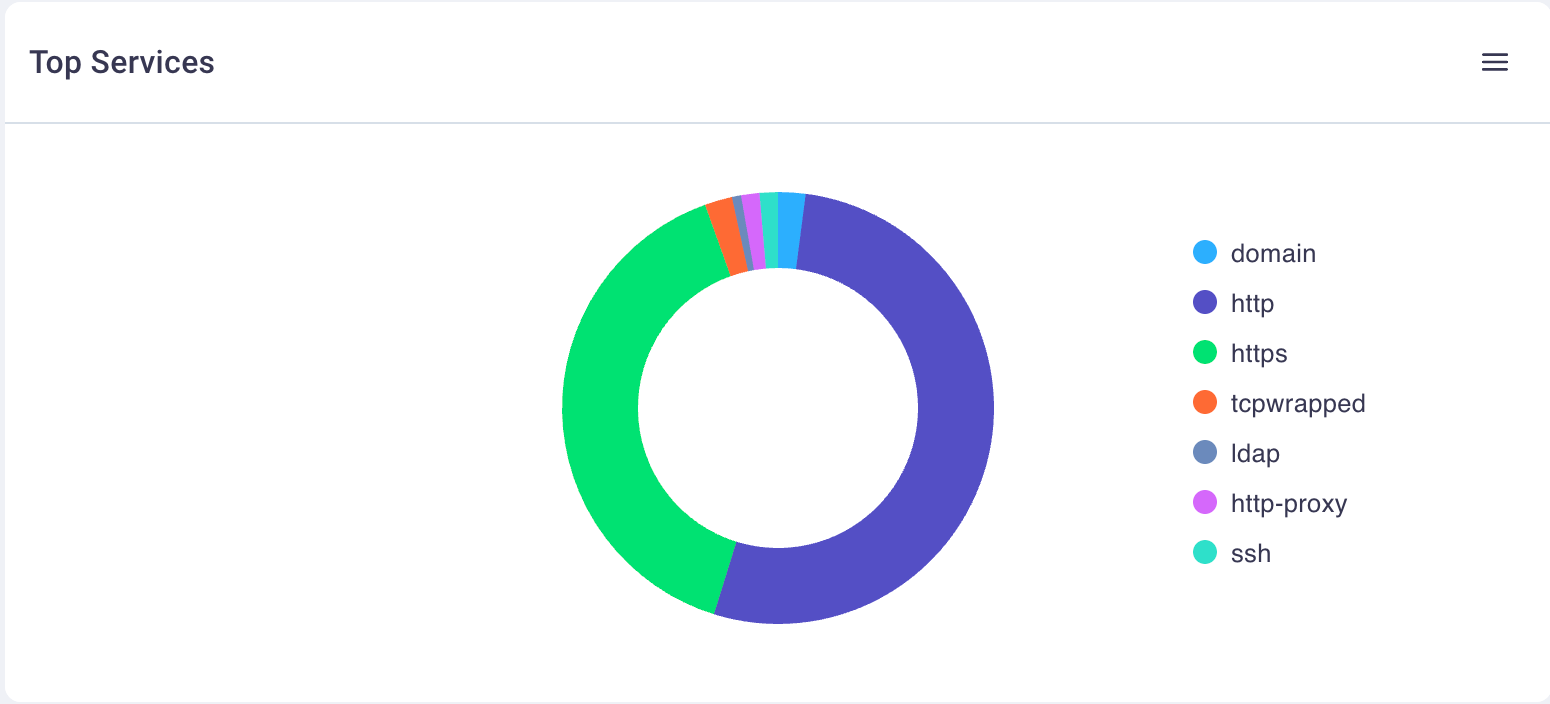
This chart supports the following actions:
Hover over any section of the donut chart to view a total count of the discovered service
Select the hamburger icon to print or download the chart
Select any service in the legend to the right of the chart to omit it from the graphic display.
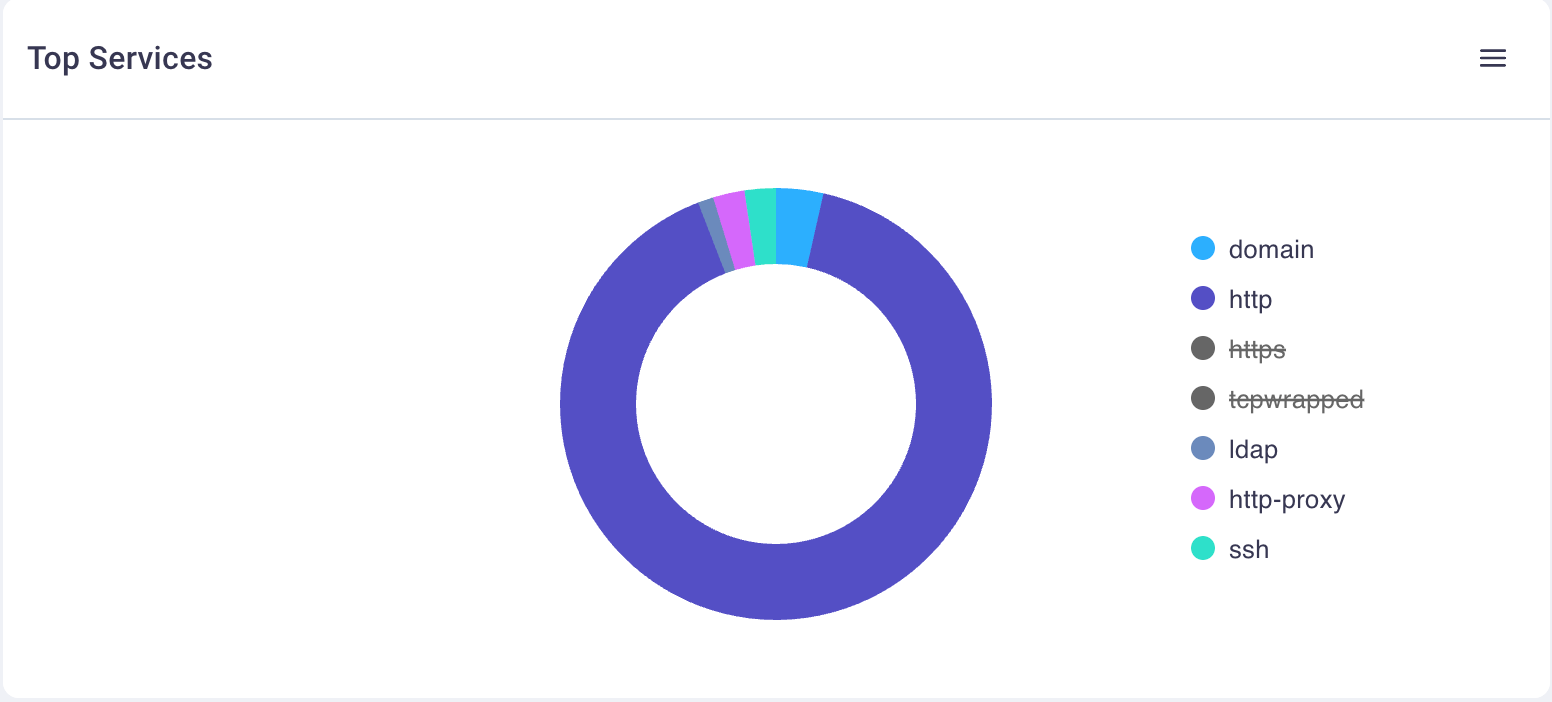
Selecting a de-selected service will enable it again for the chart display.
#
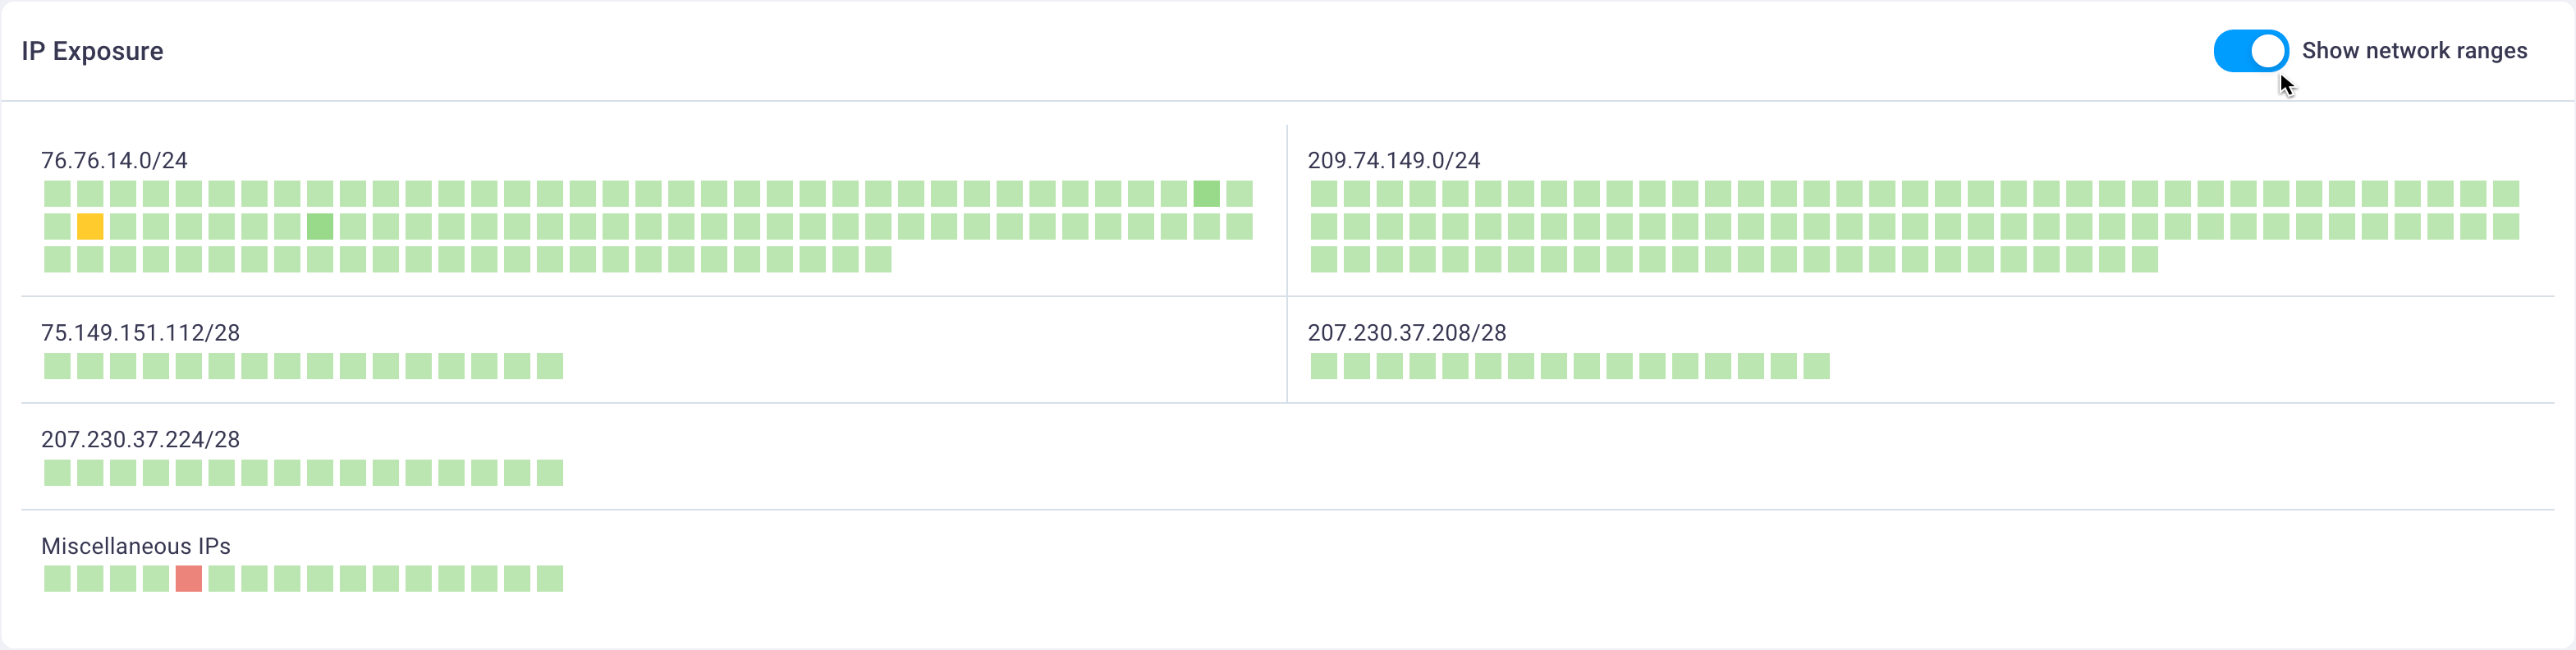
6. IP Exposure graph
The IP Exposure graph displays your organization's IPs and number of ports when hovering over the graphic elements.
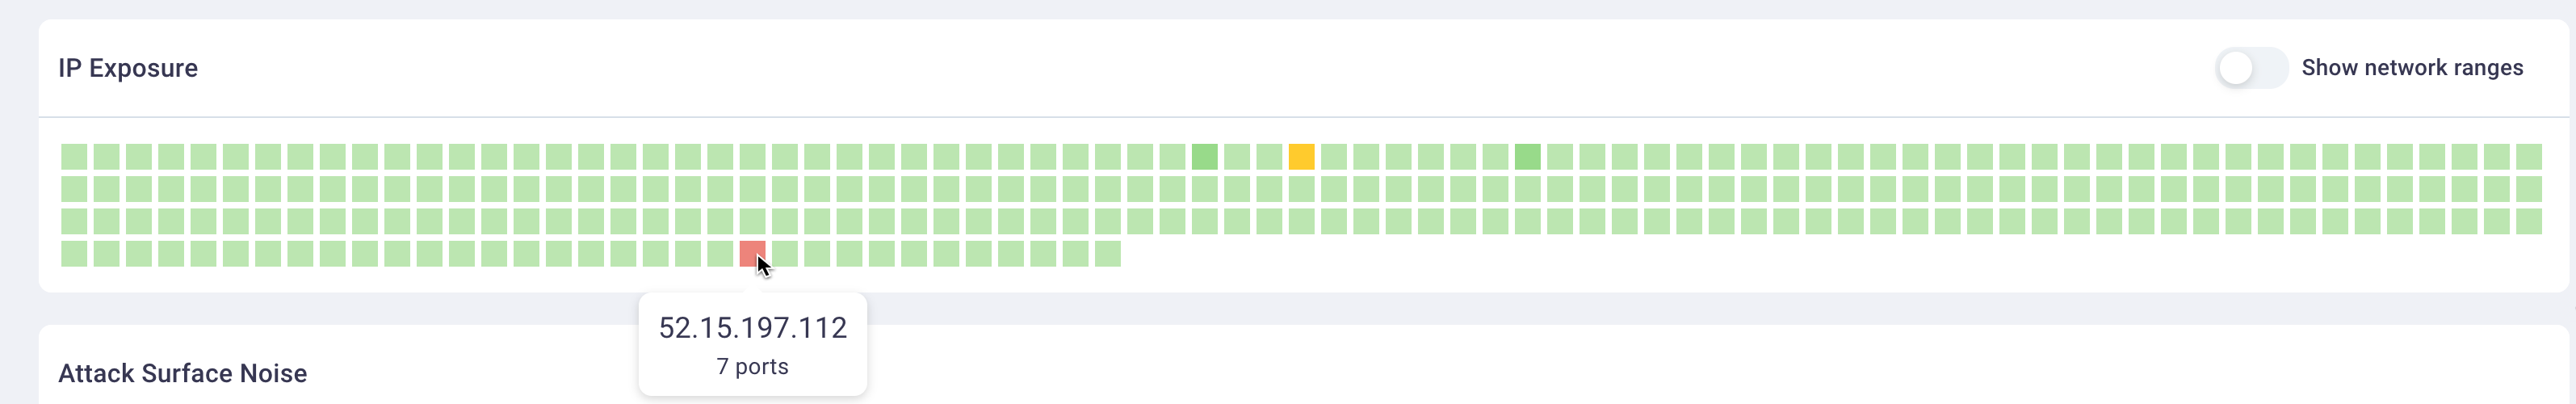
Selecting the Show network ranges slider button displays the network ranges.
#
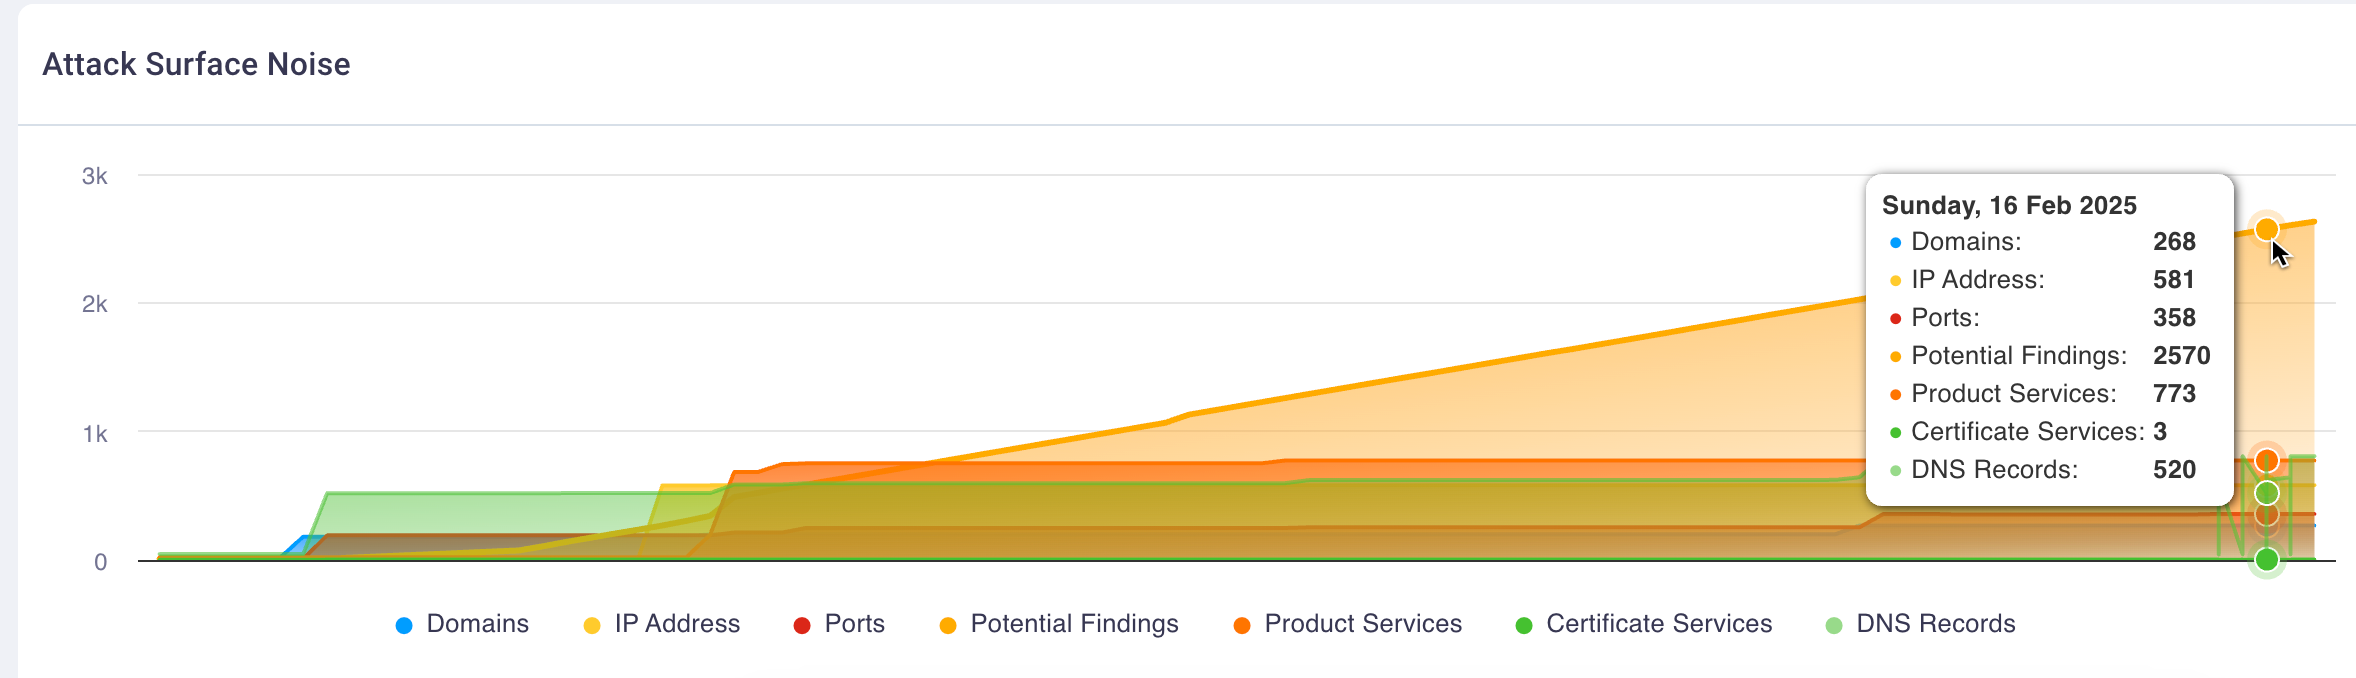
7. Attack Surface Noise chart
The Attack Surface Noise chart displays an area chart representing all of your organization's assets and exposures, and relates the number of findings discovered in relation to that number of assets to calculate the noise reduction to your team.
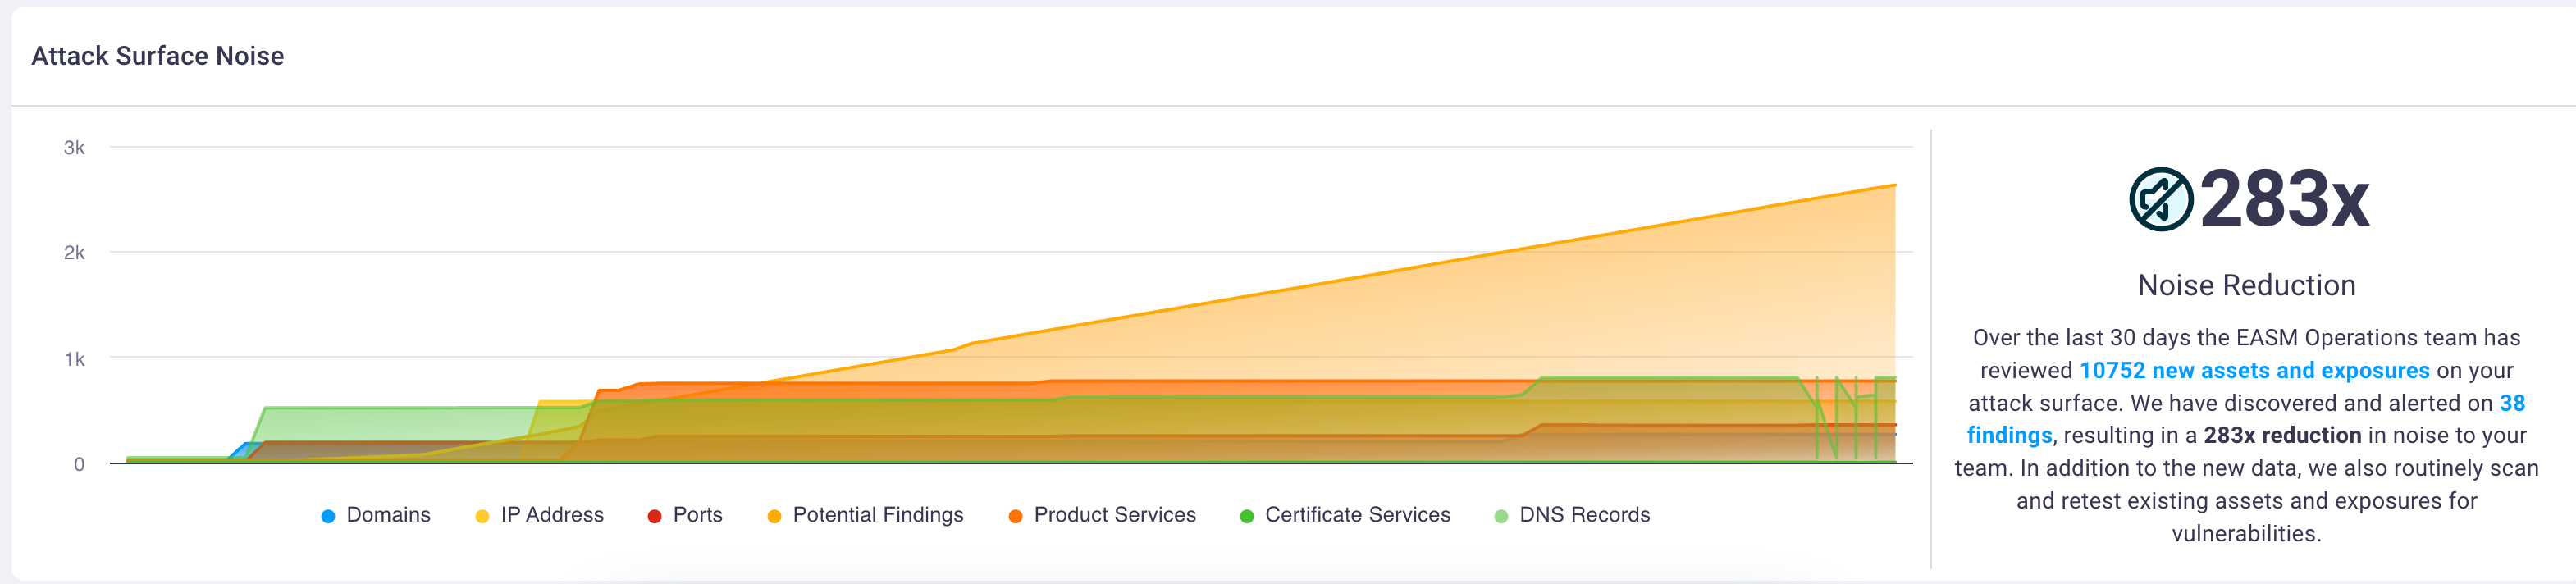
Hovering over any of the lines in the chart displays the asset count for that date along with potential findings.