#
Dark Web dashboard
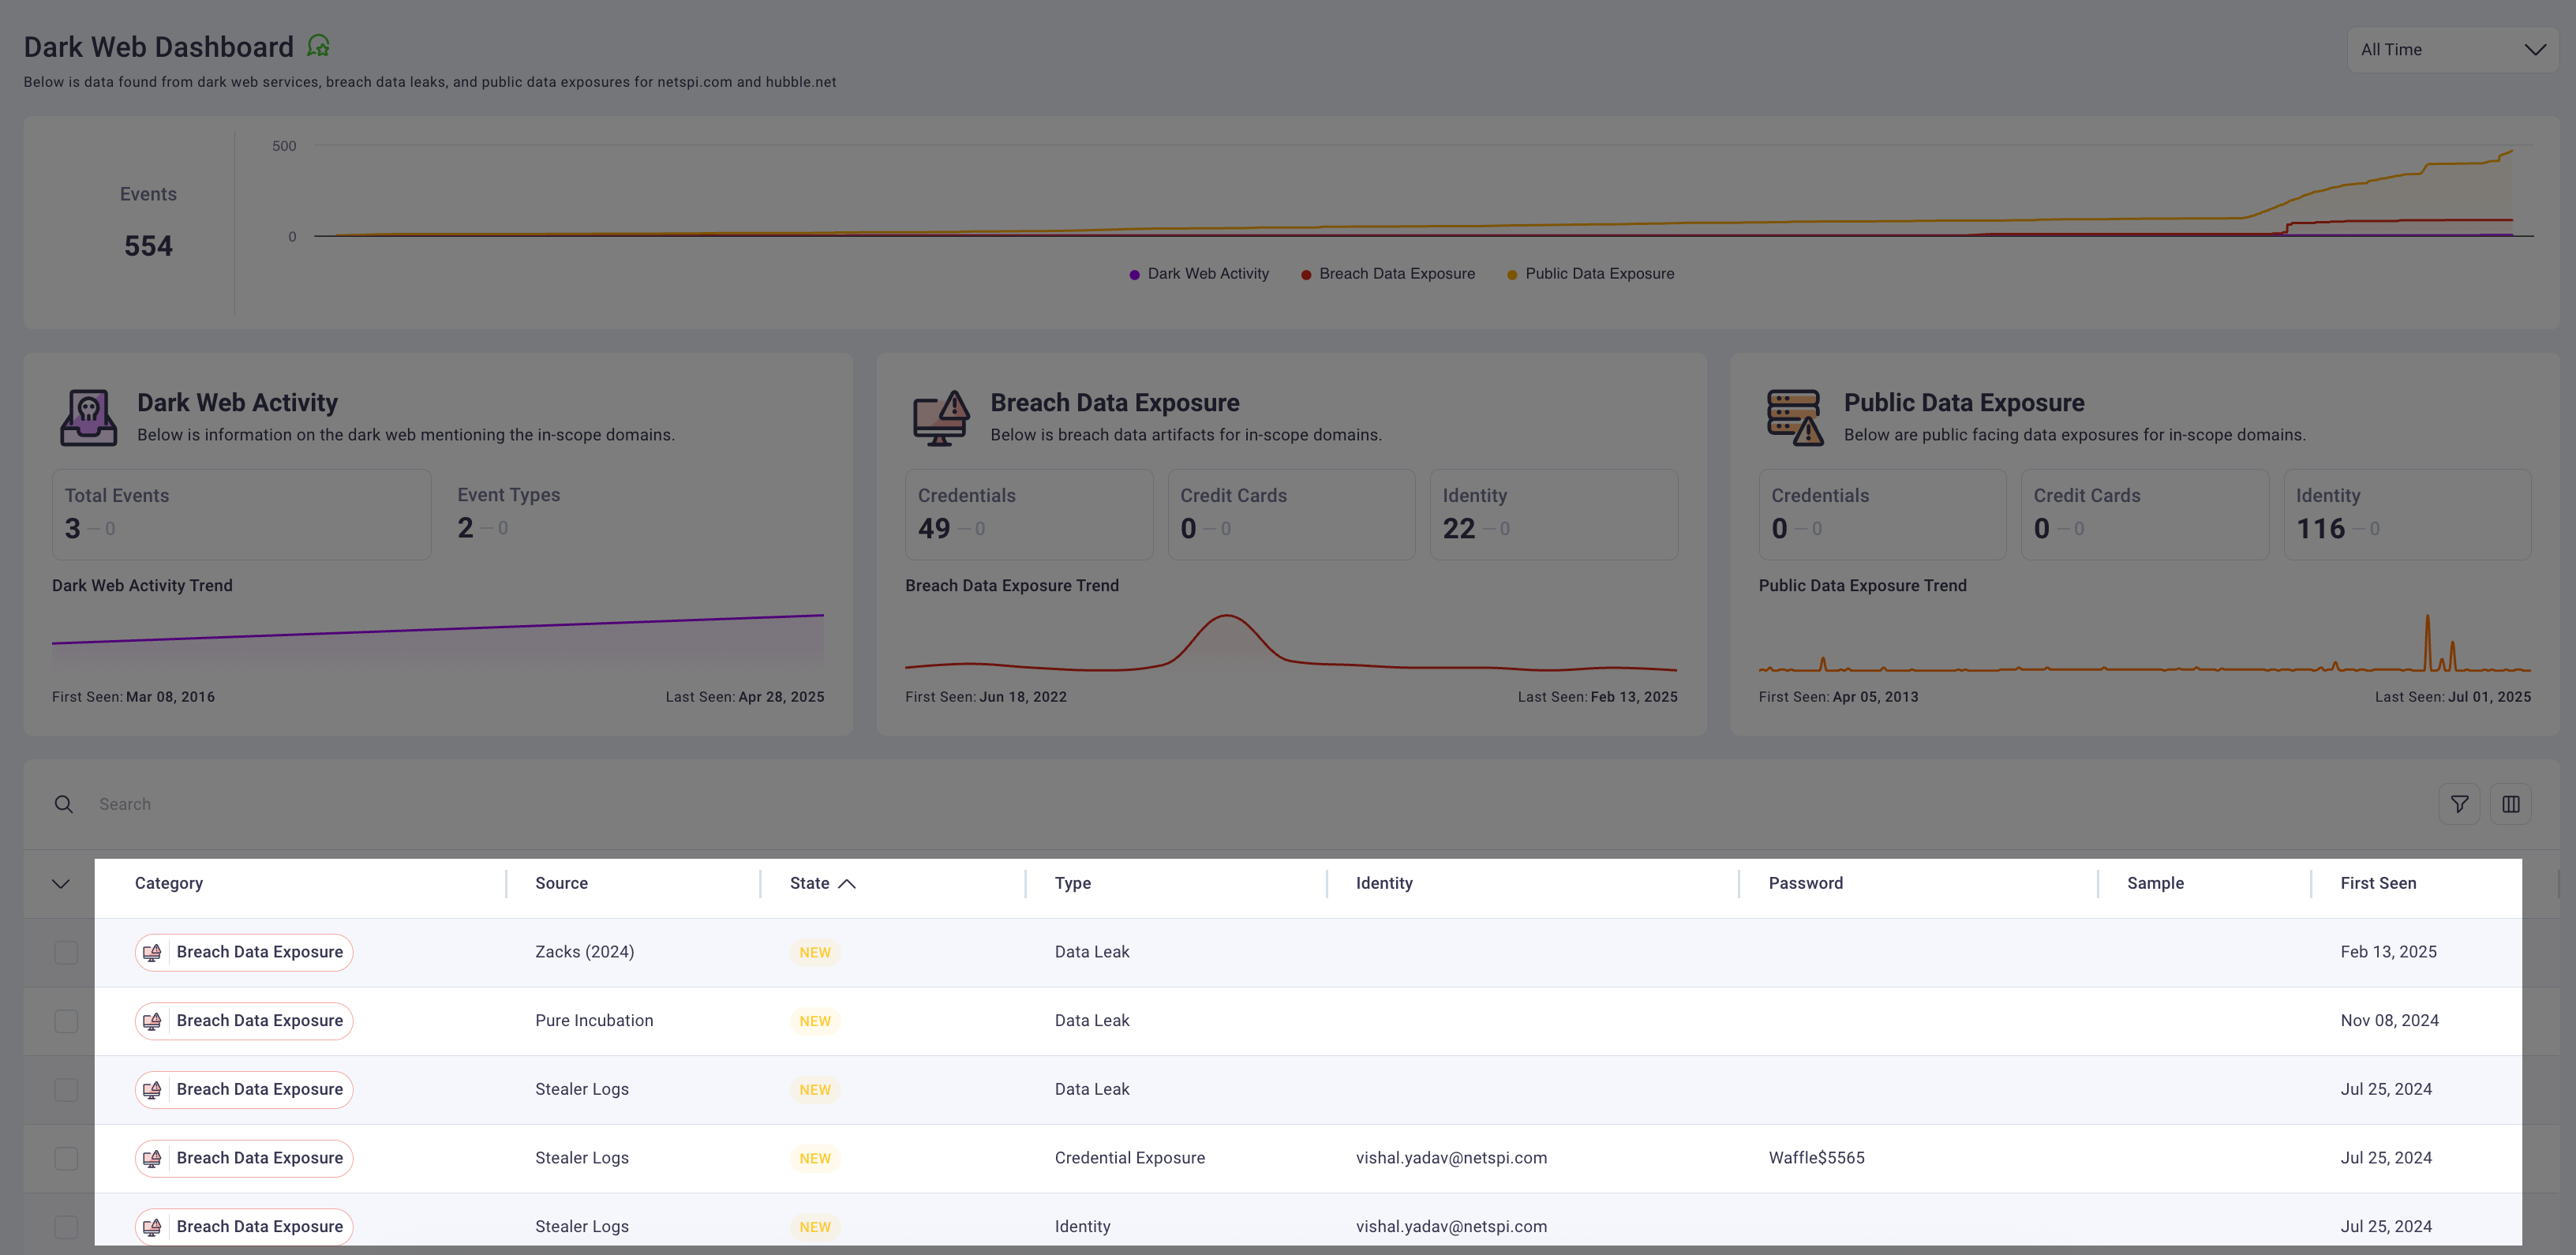
The Dark Web Dashboard provides comprehensive monitoring and analysis of your organization's exposure across dark web sources, breach databases, and public data platforms. This centralized threat intelligence tool consolidates multiple data sources into a unified interface that enables security teams to proactively detect, investigate, and remediate potential security incidents involving exposed credentials, sensitive information, and organizational mentions.
#
Dark Web dashboard overview
The table below provides a high level description of available actions on this dashboard, followed in more detail in the sections below it.
#
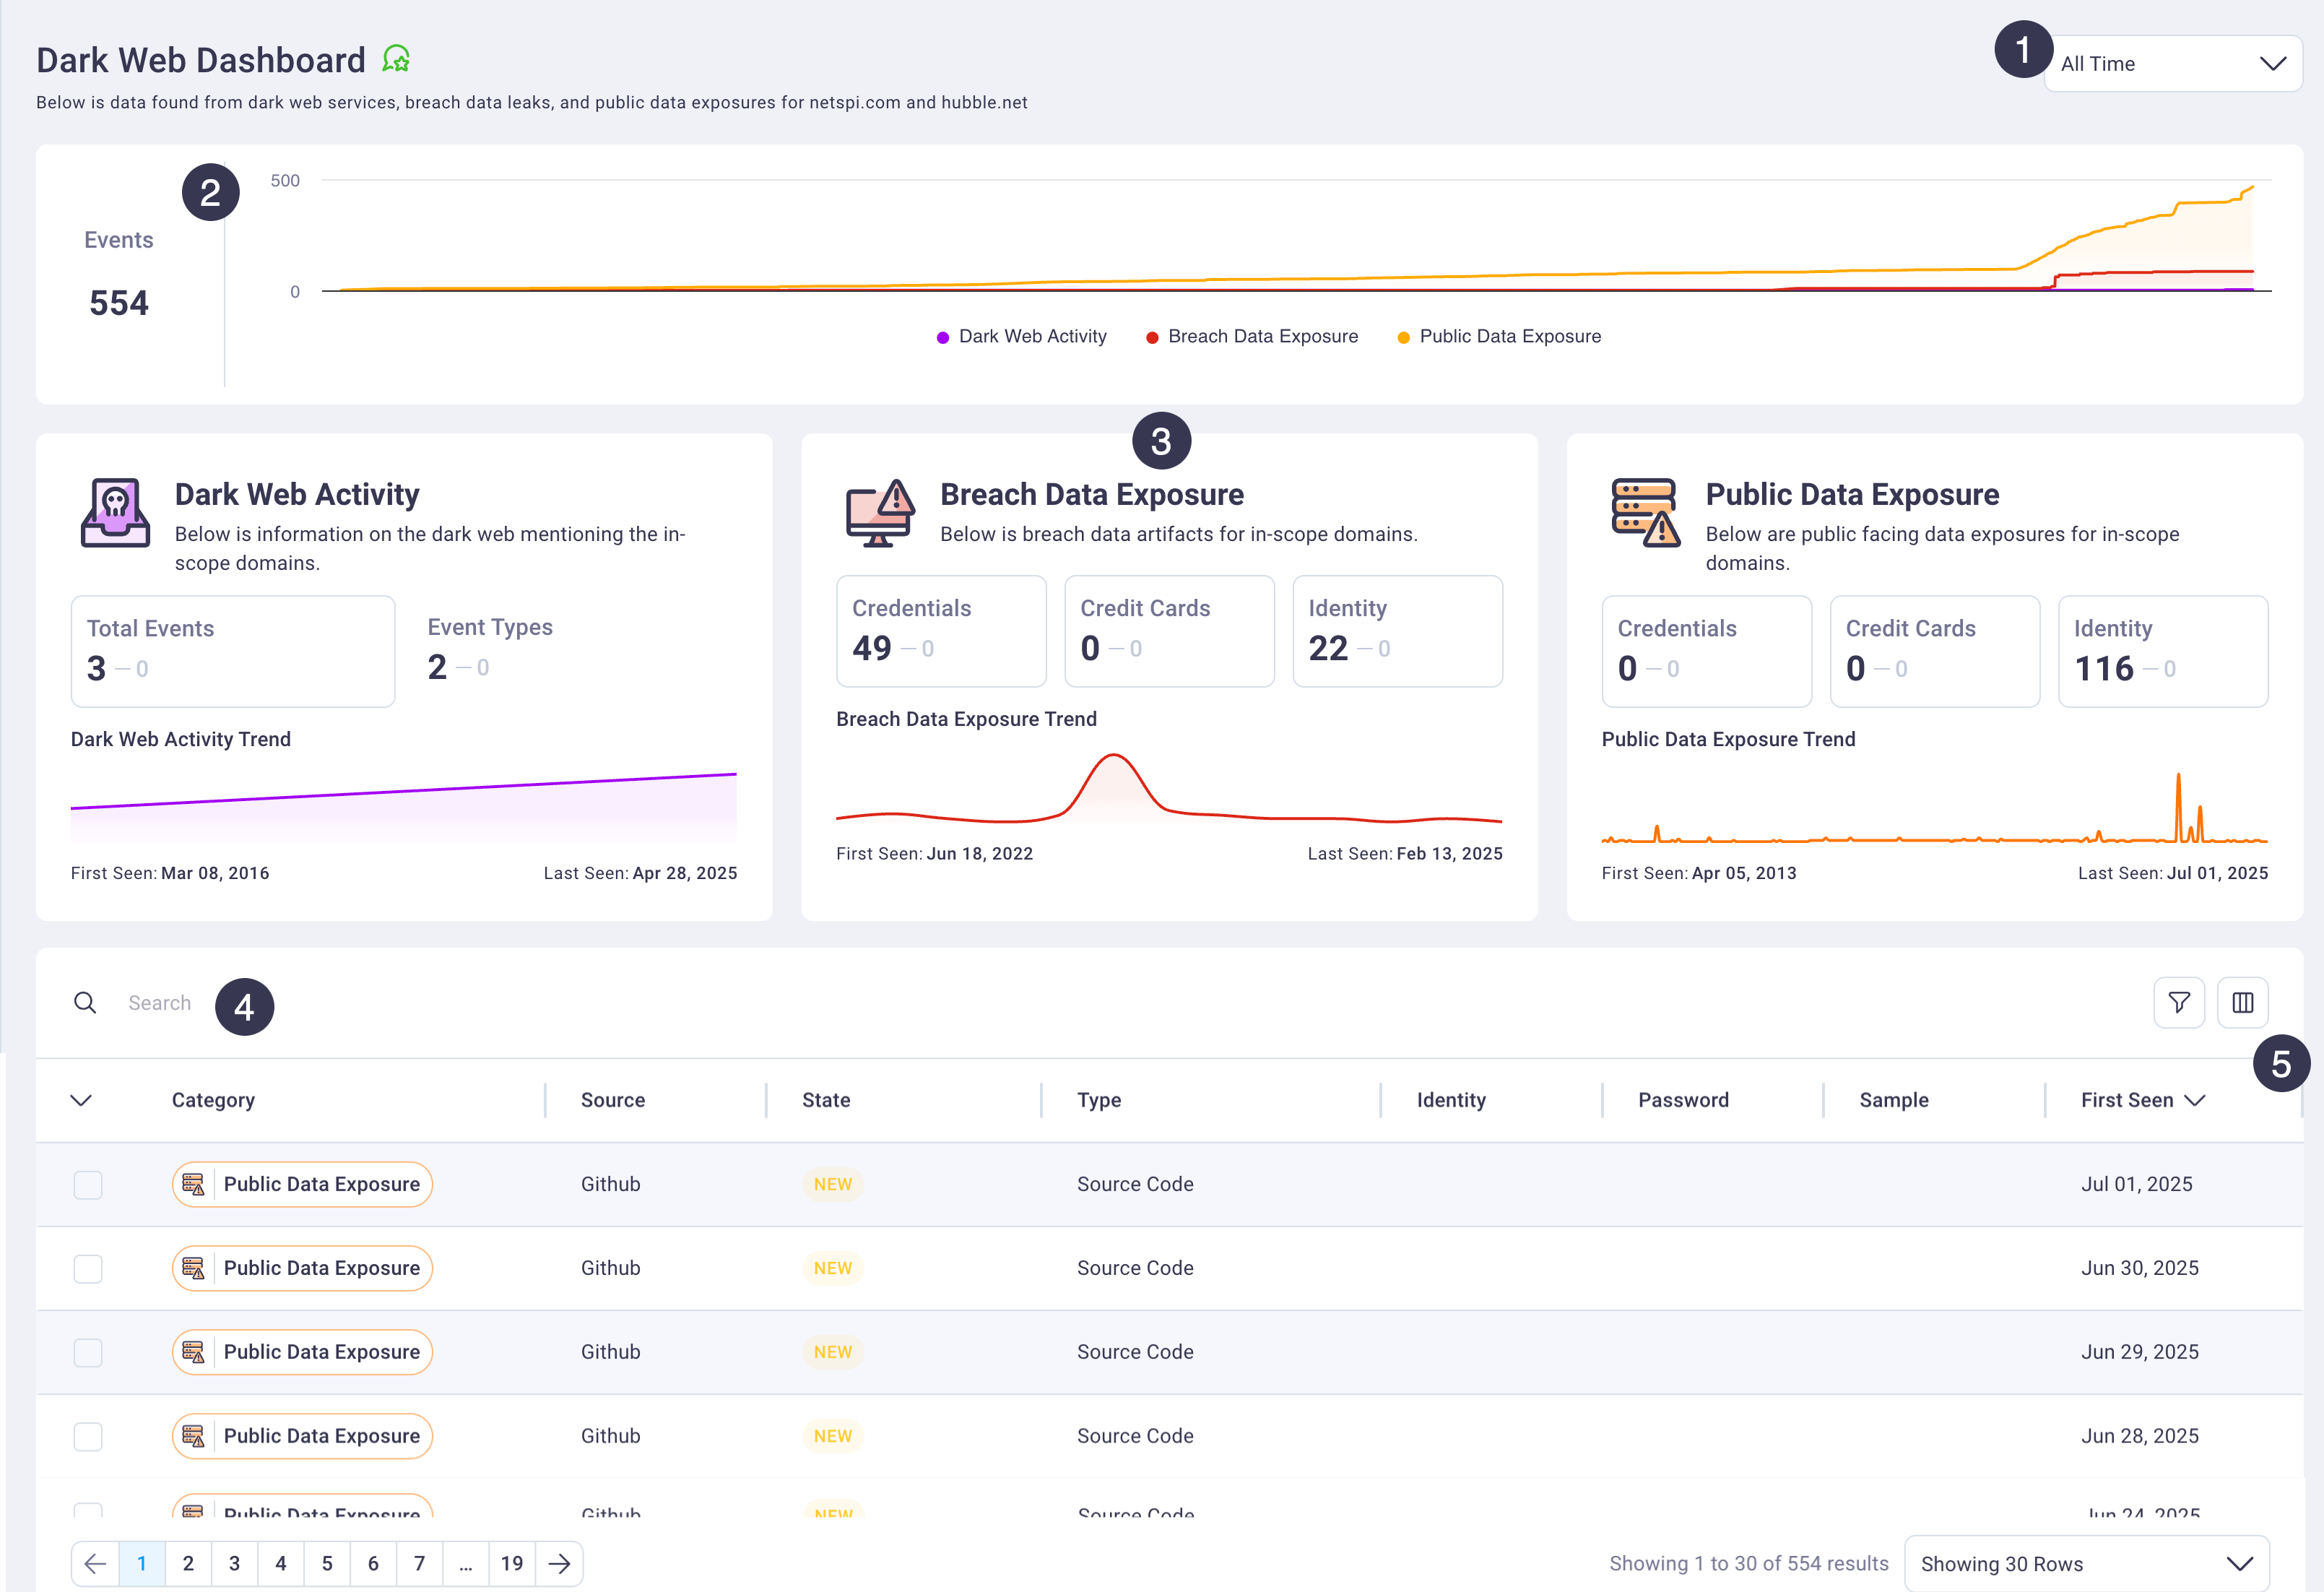
1. Time range control
Select the time period for which you want to review dark web threat intelligence data. The dashboard supports filtering for the past day, week, month, quarter, all time view, or custom date ranges. Your selection automatically updates all information cards, charts, and the detailed events table to reflect data from the specified period.
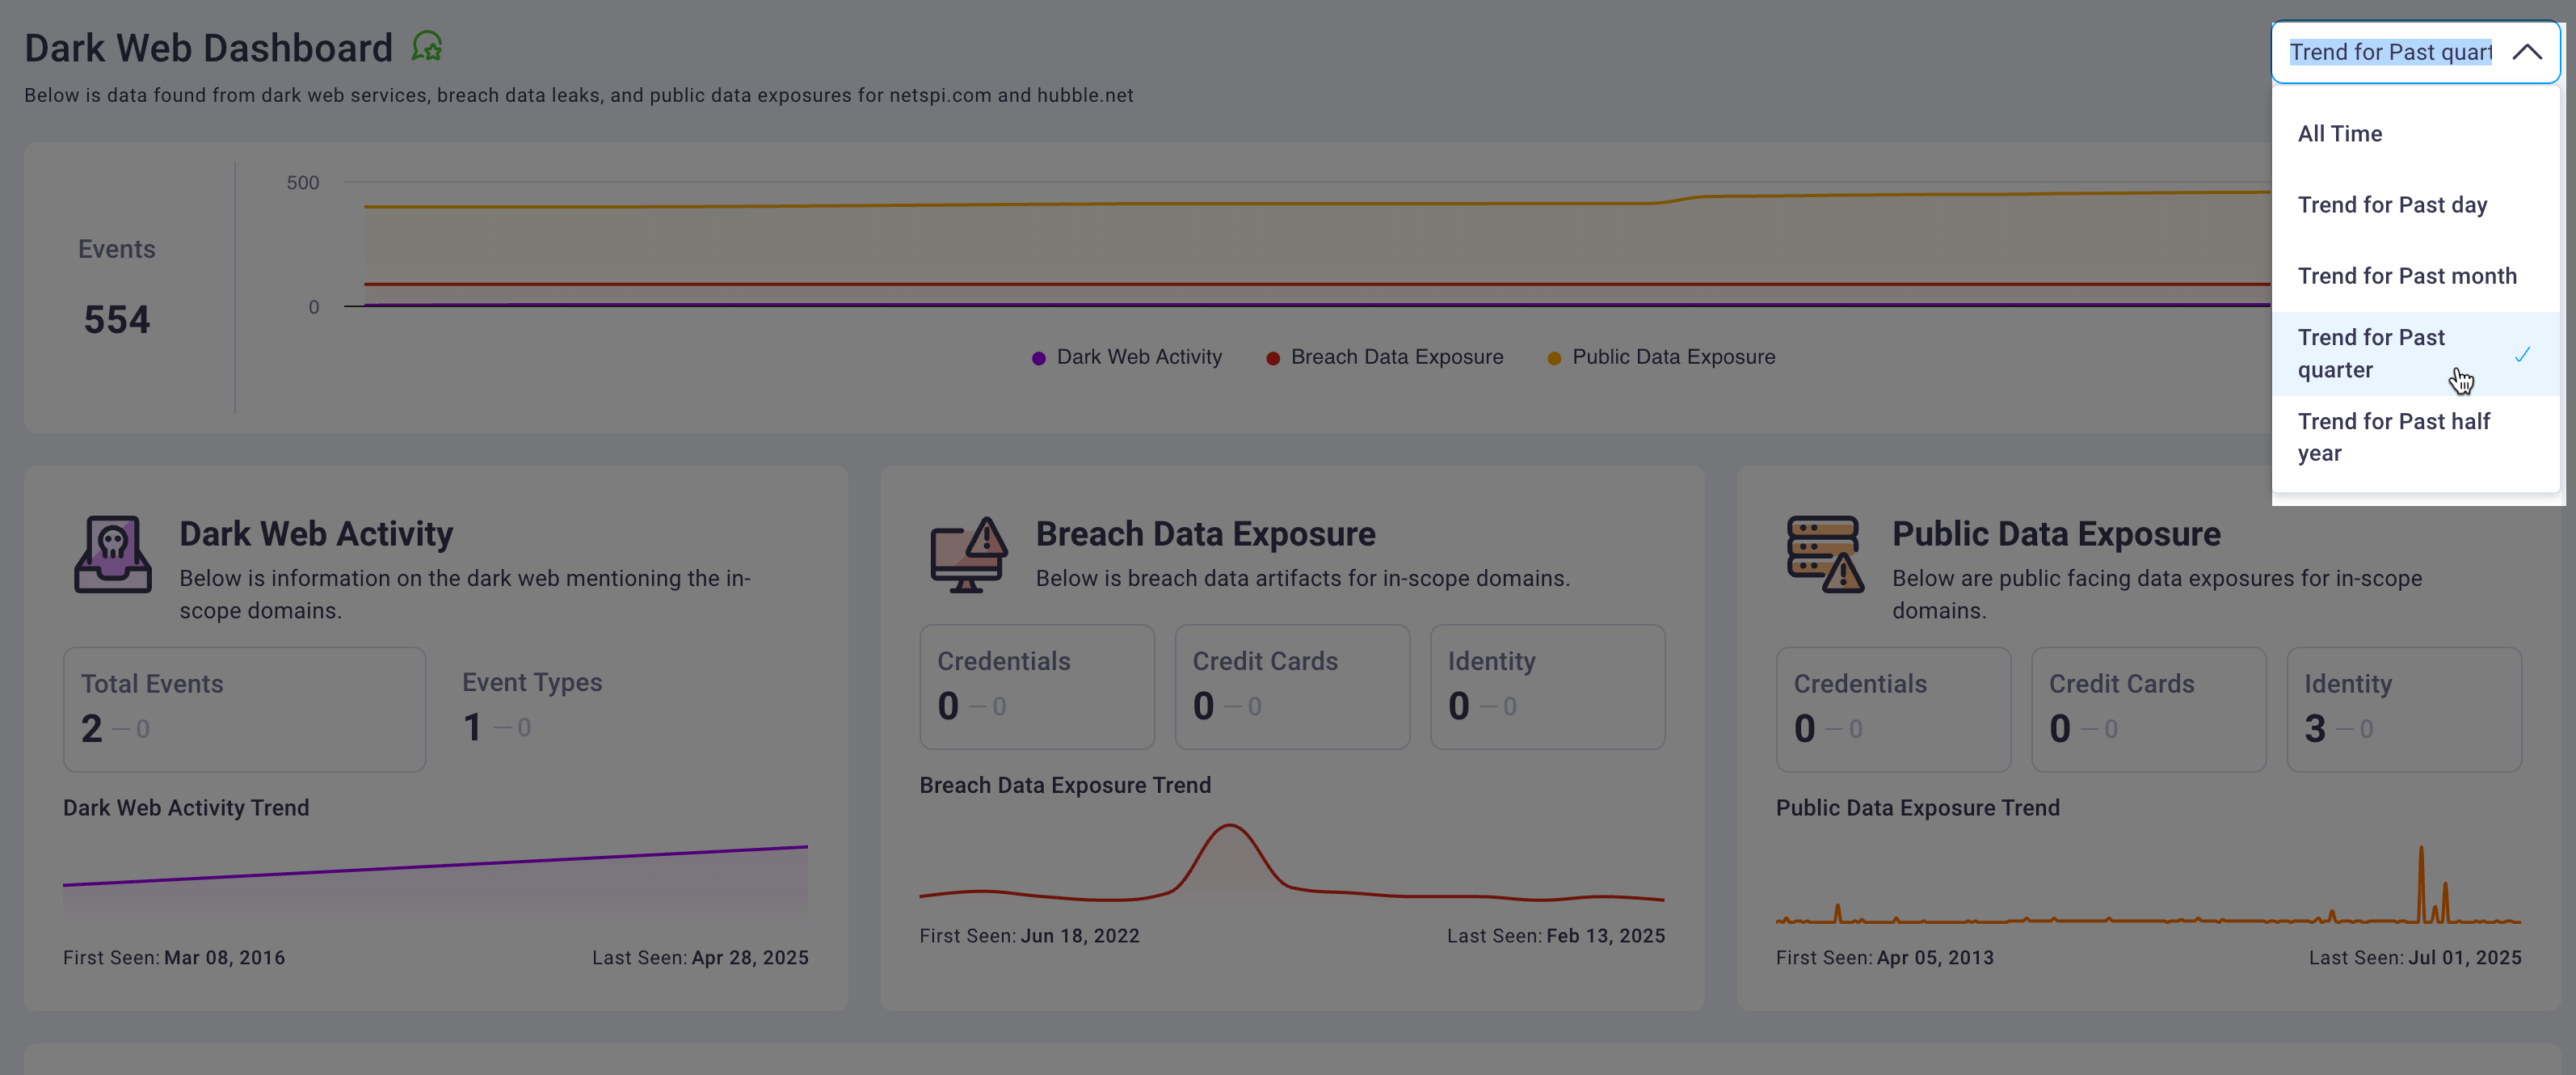
The default view displays all time data to provide the most comprehensive threat landscape overview. Changing the time filter updates the events timeline graph, threat summary cards, and all table data to match your selected timeframe.
#
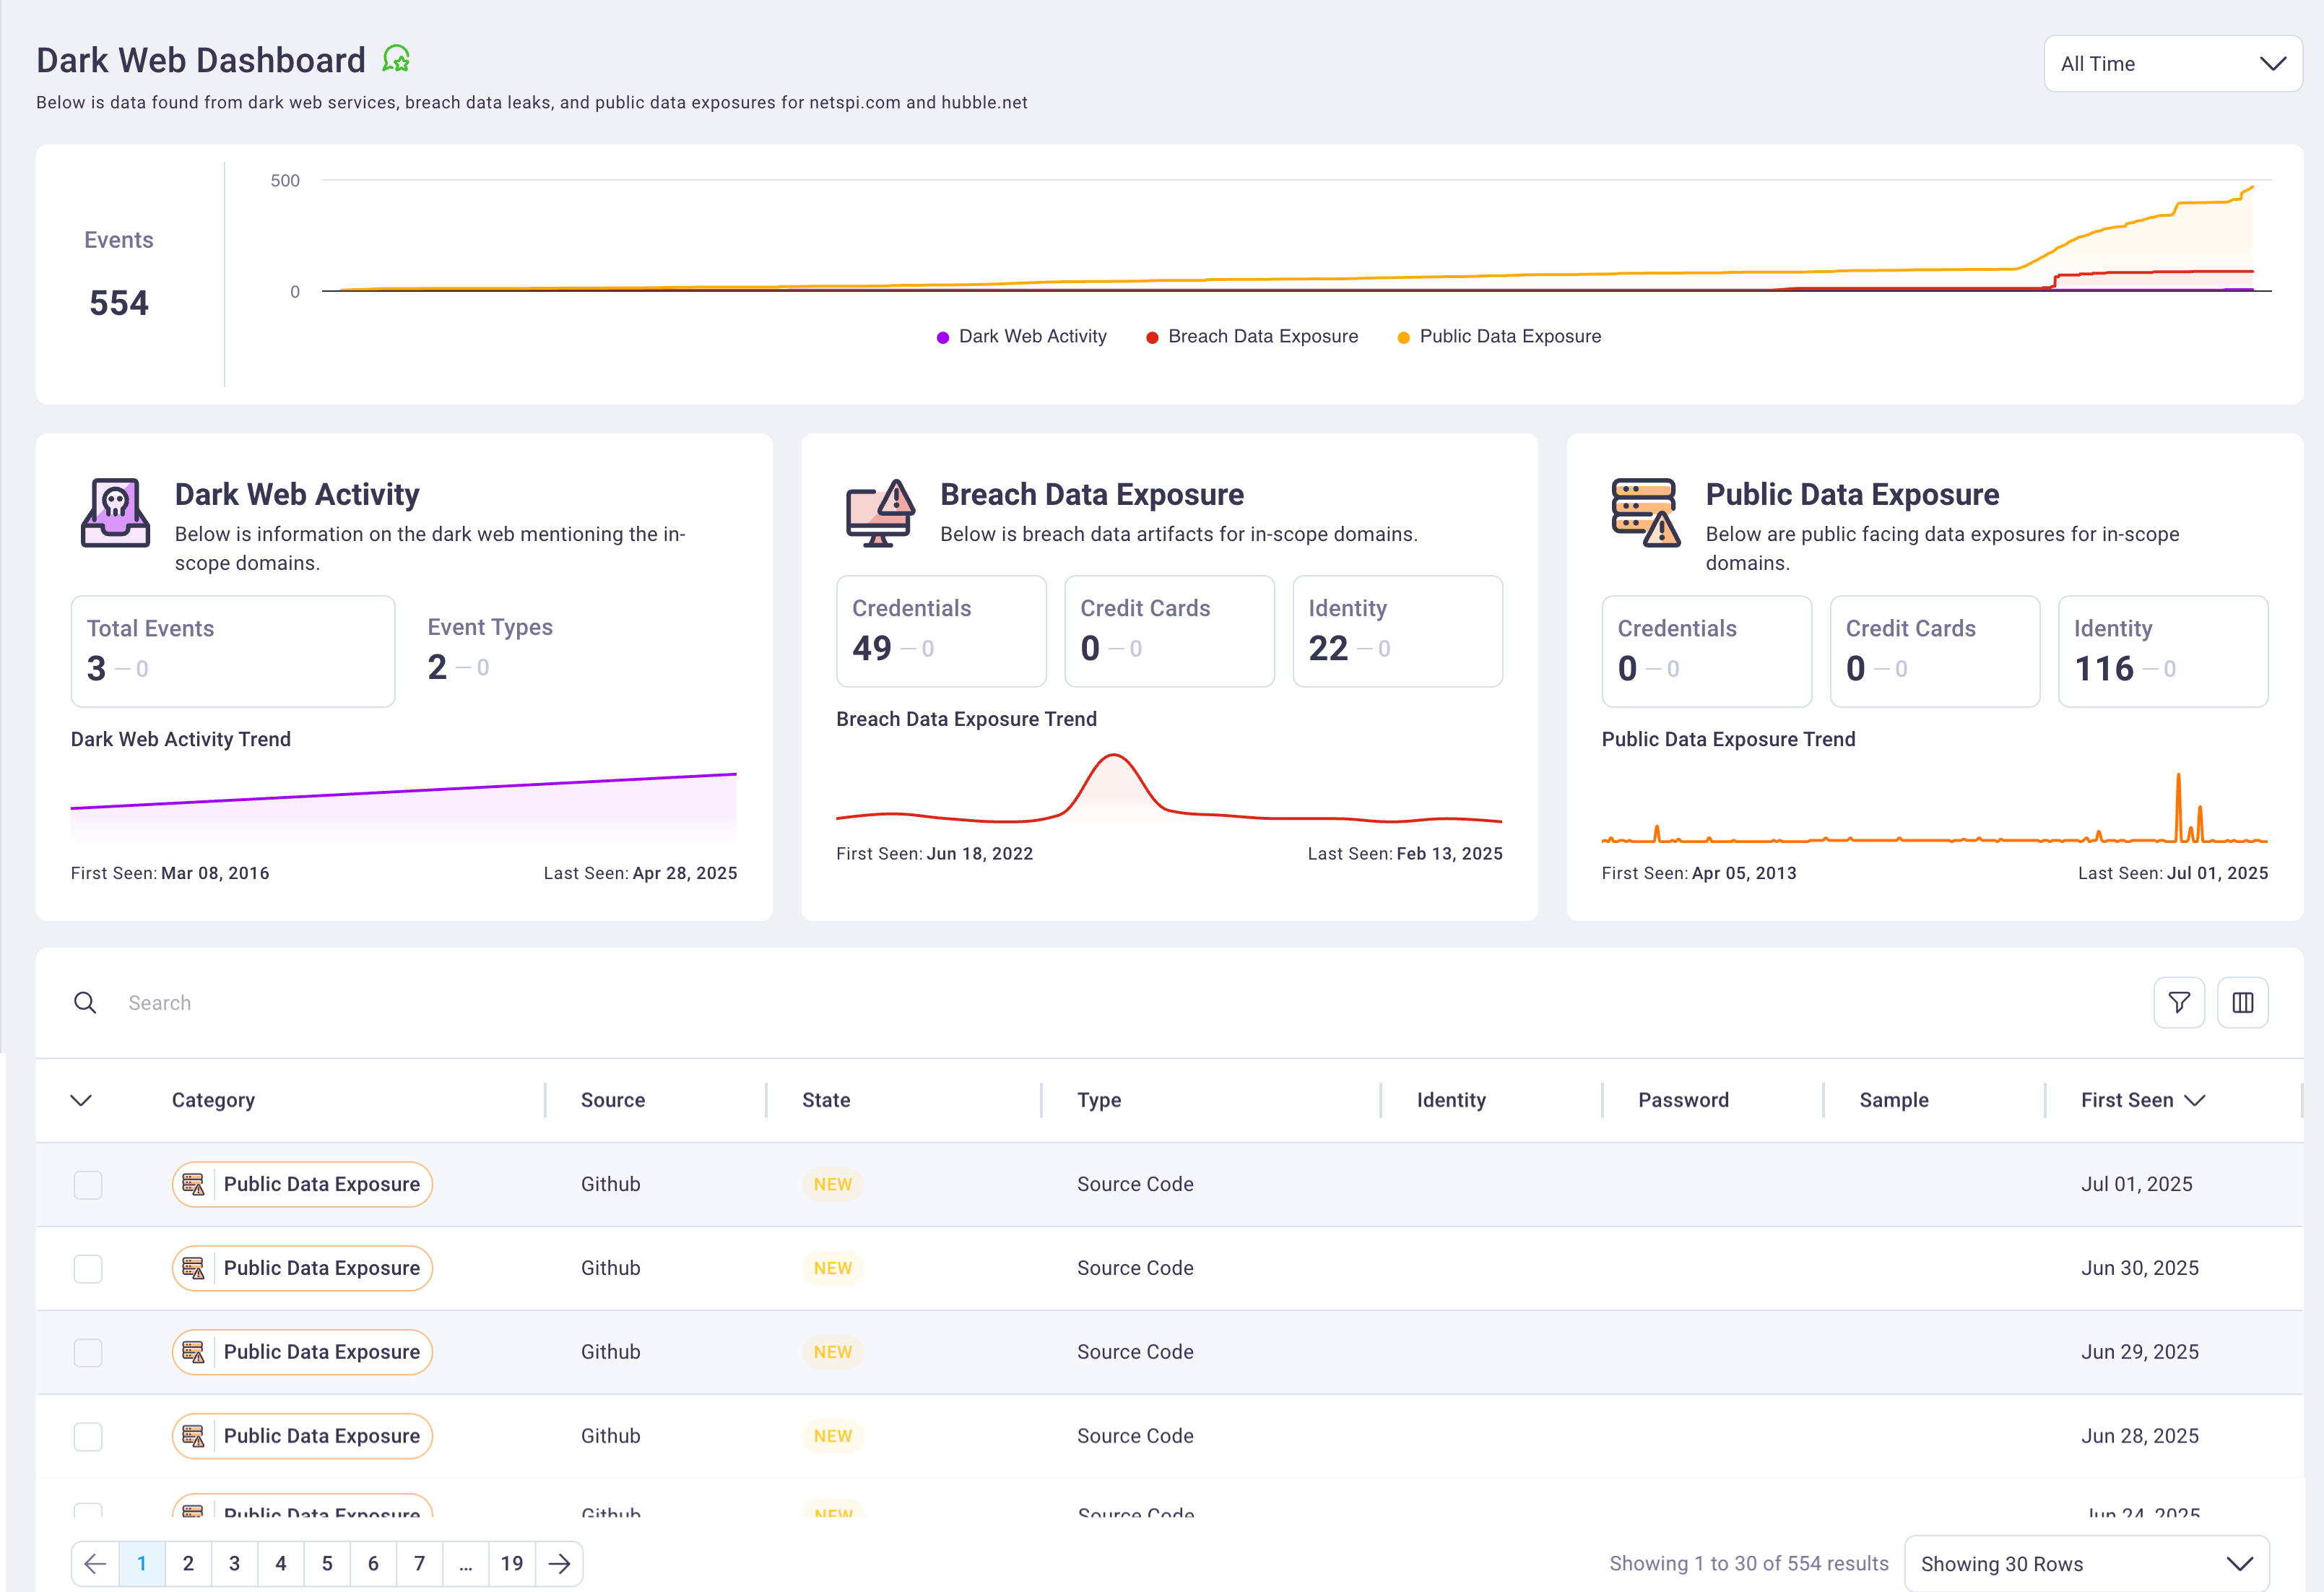
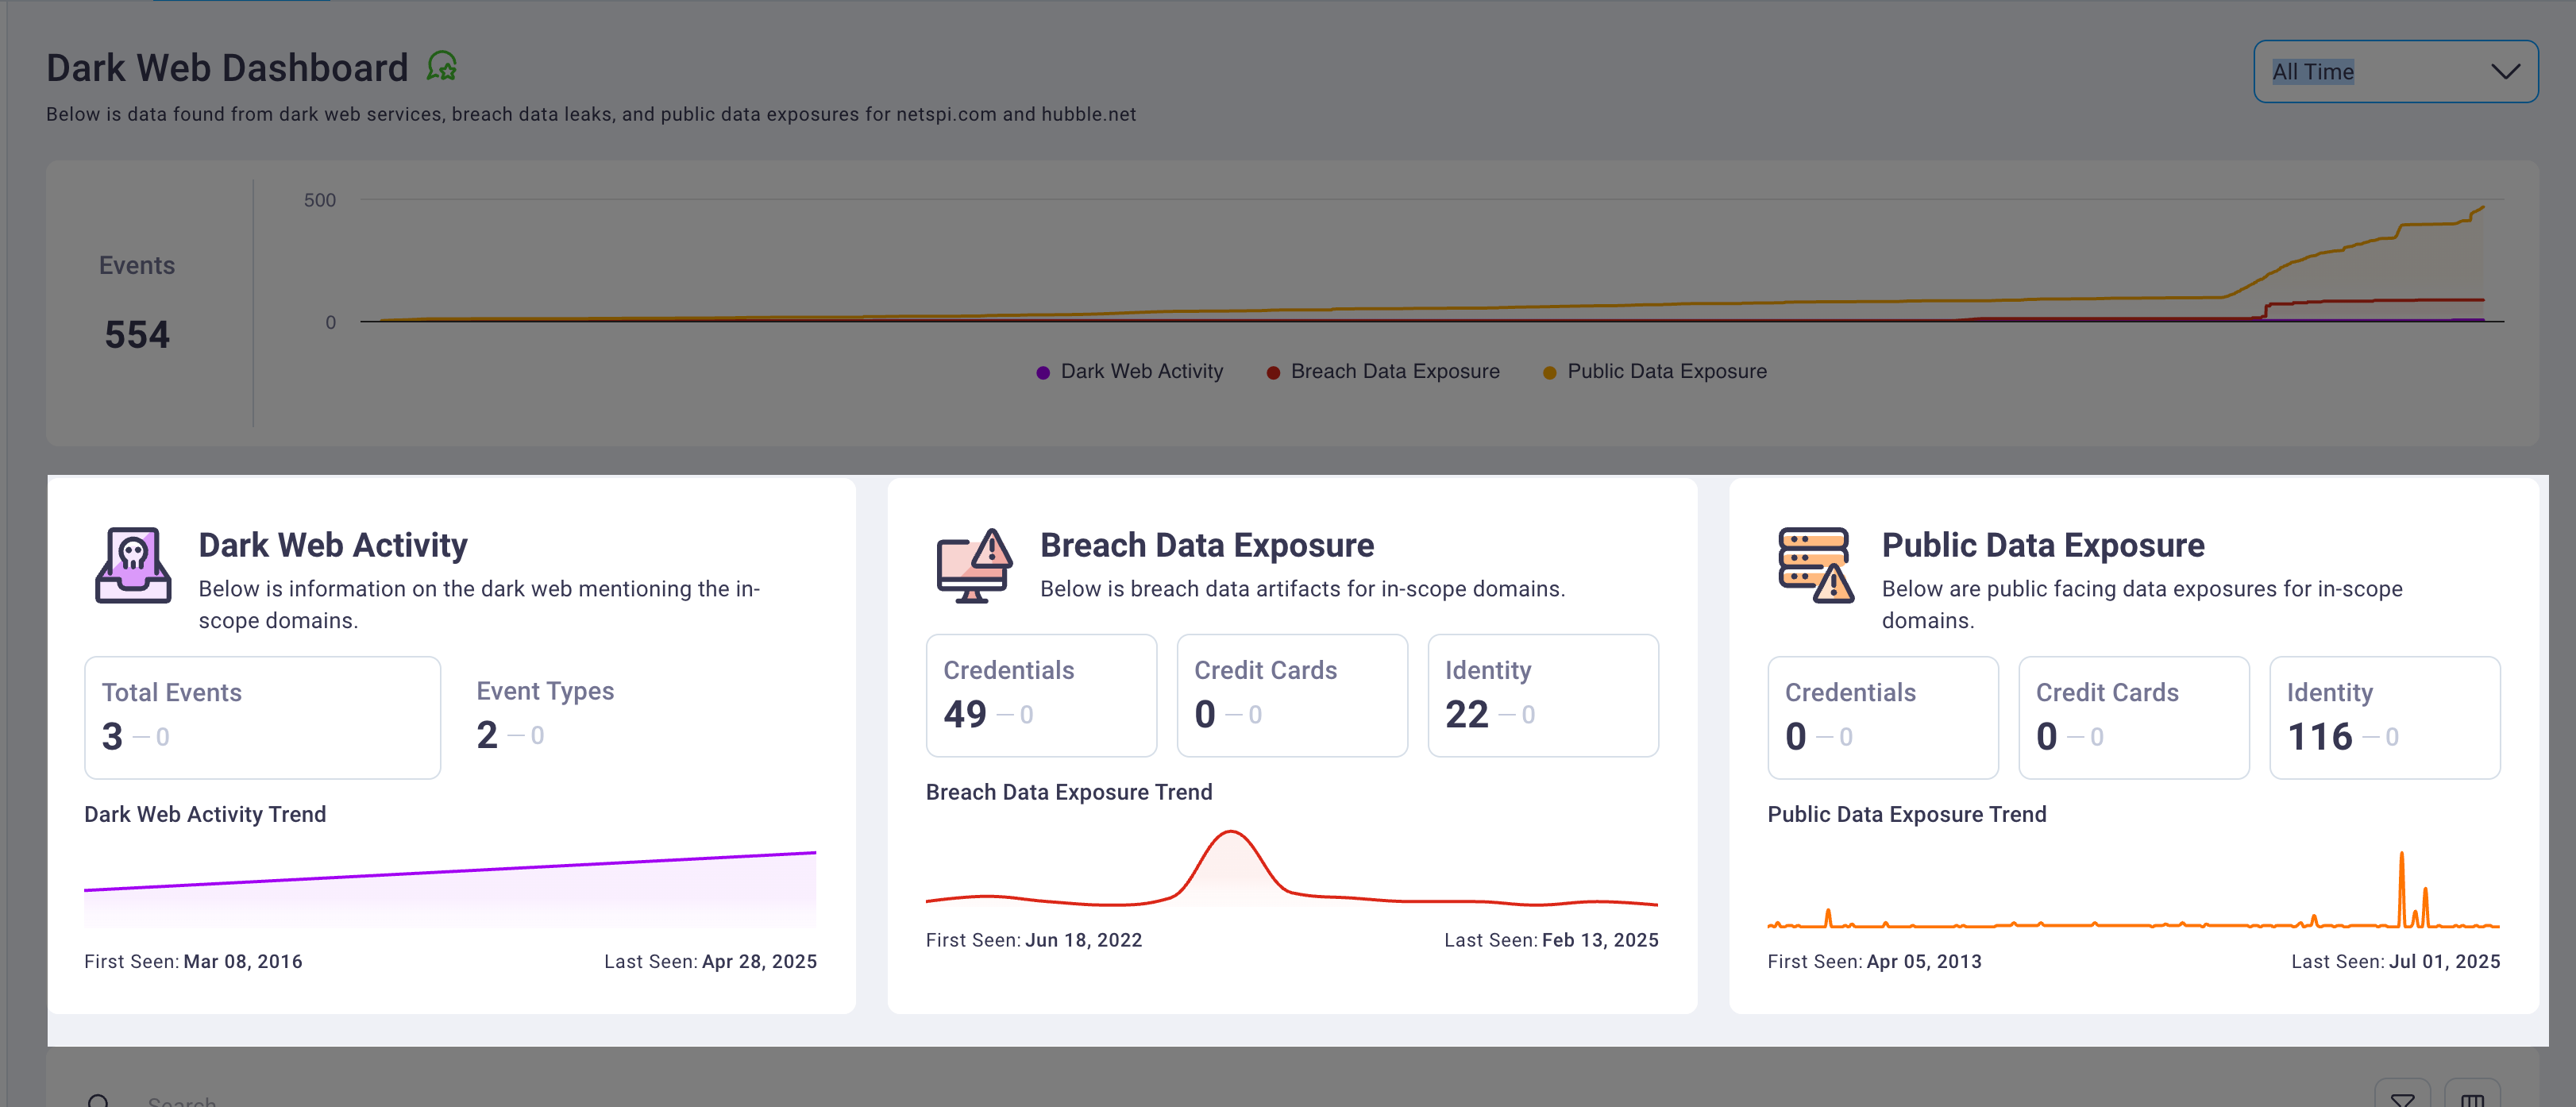
2. Events timeline graph
The events timeline graph provides a cumulative time series visualization of dark web event activity over your selected time period. This graph enables security teams to identify threat patterns, activity spikes, and trends in organizational exposure across monitored sources.
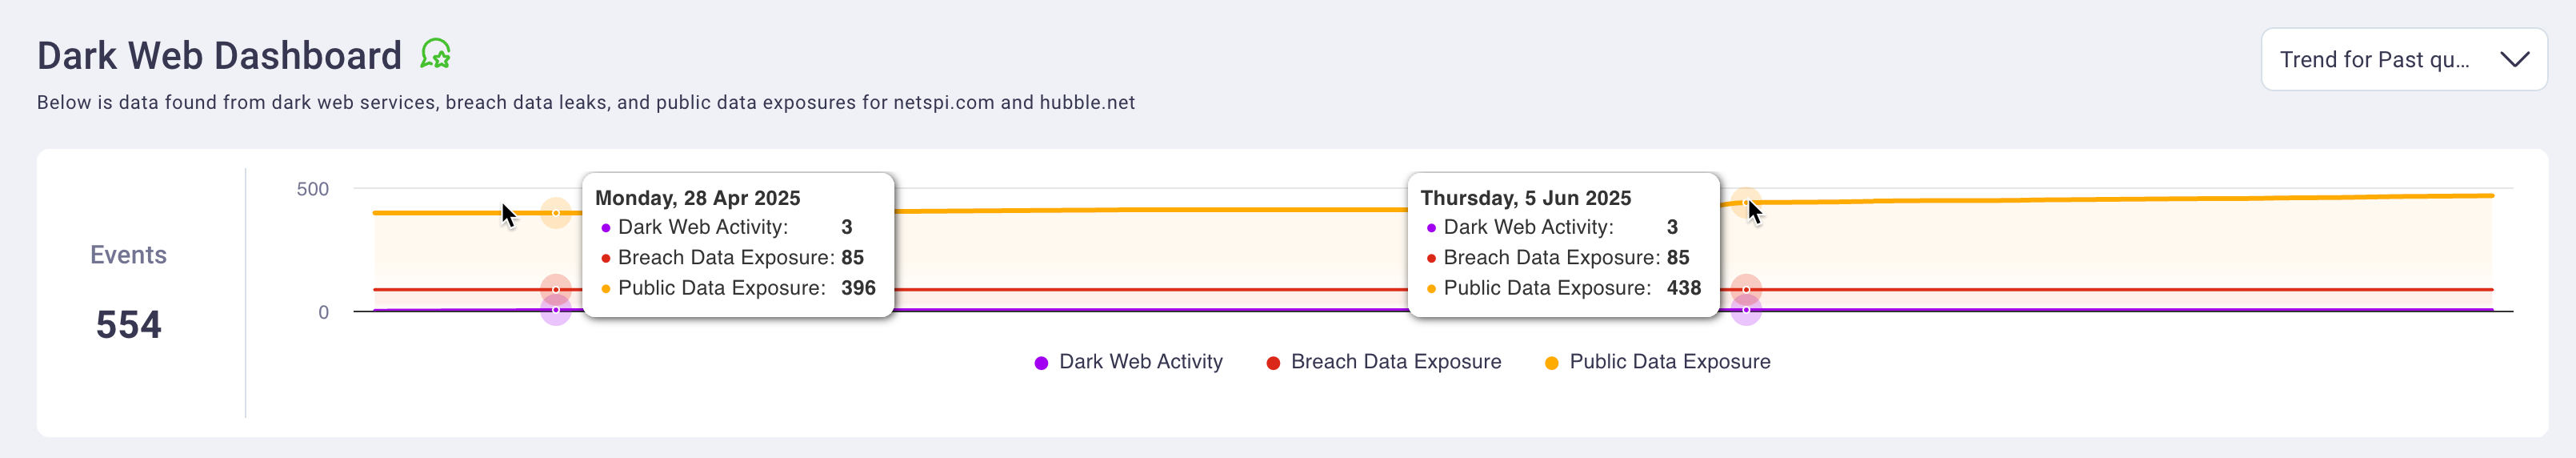
The timeline visualization supports interactive exploration where hovering over data points reveals specific event counts and dates. The graph automatically adjusts its scale and data presentation based on your selected time range filter, providing optimized visualization whether you're examining daily activity patterns or long-term threat trends.
#
3. Threat summary cards
The threat summary cards display categorized counts of detected exposures organized by threat type across three primary categories: dark web activity, breach data exposures, and public data leaks.
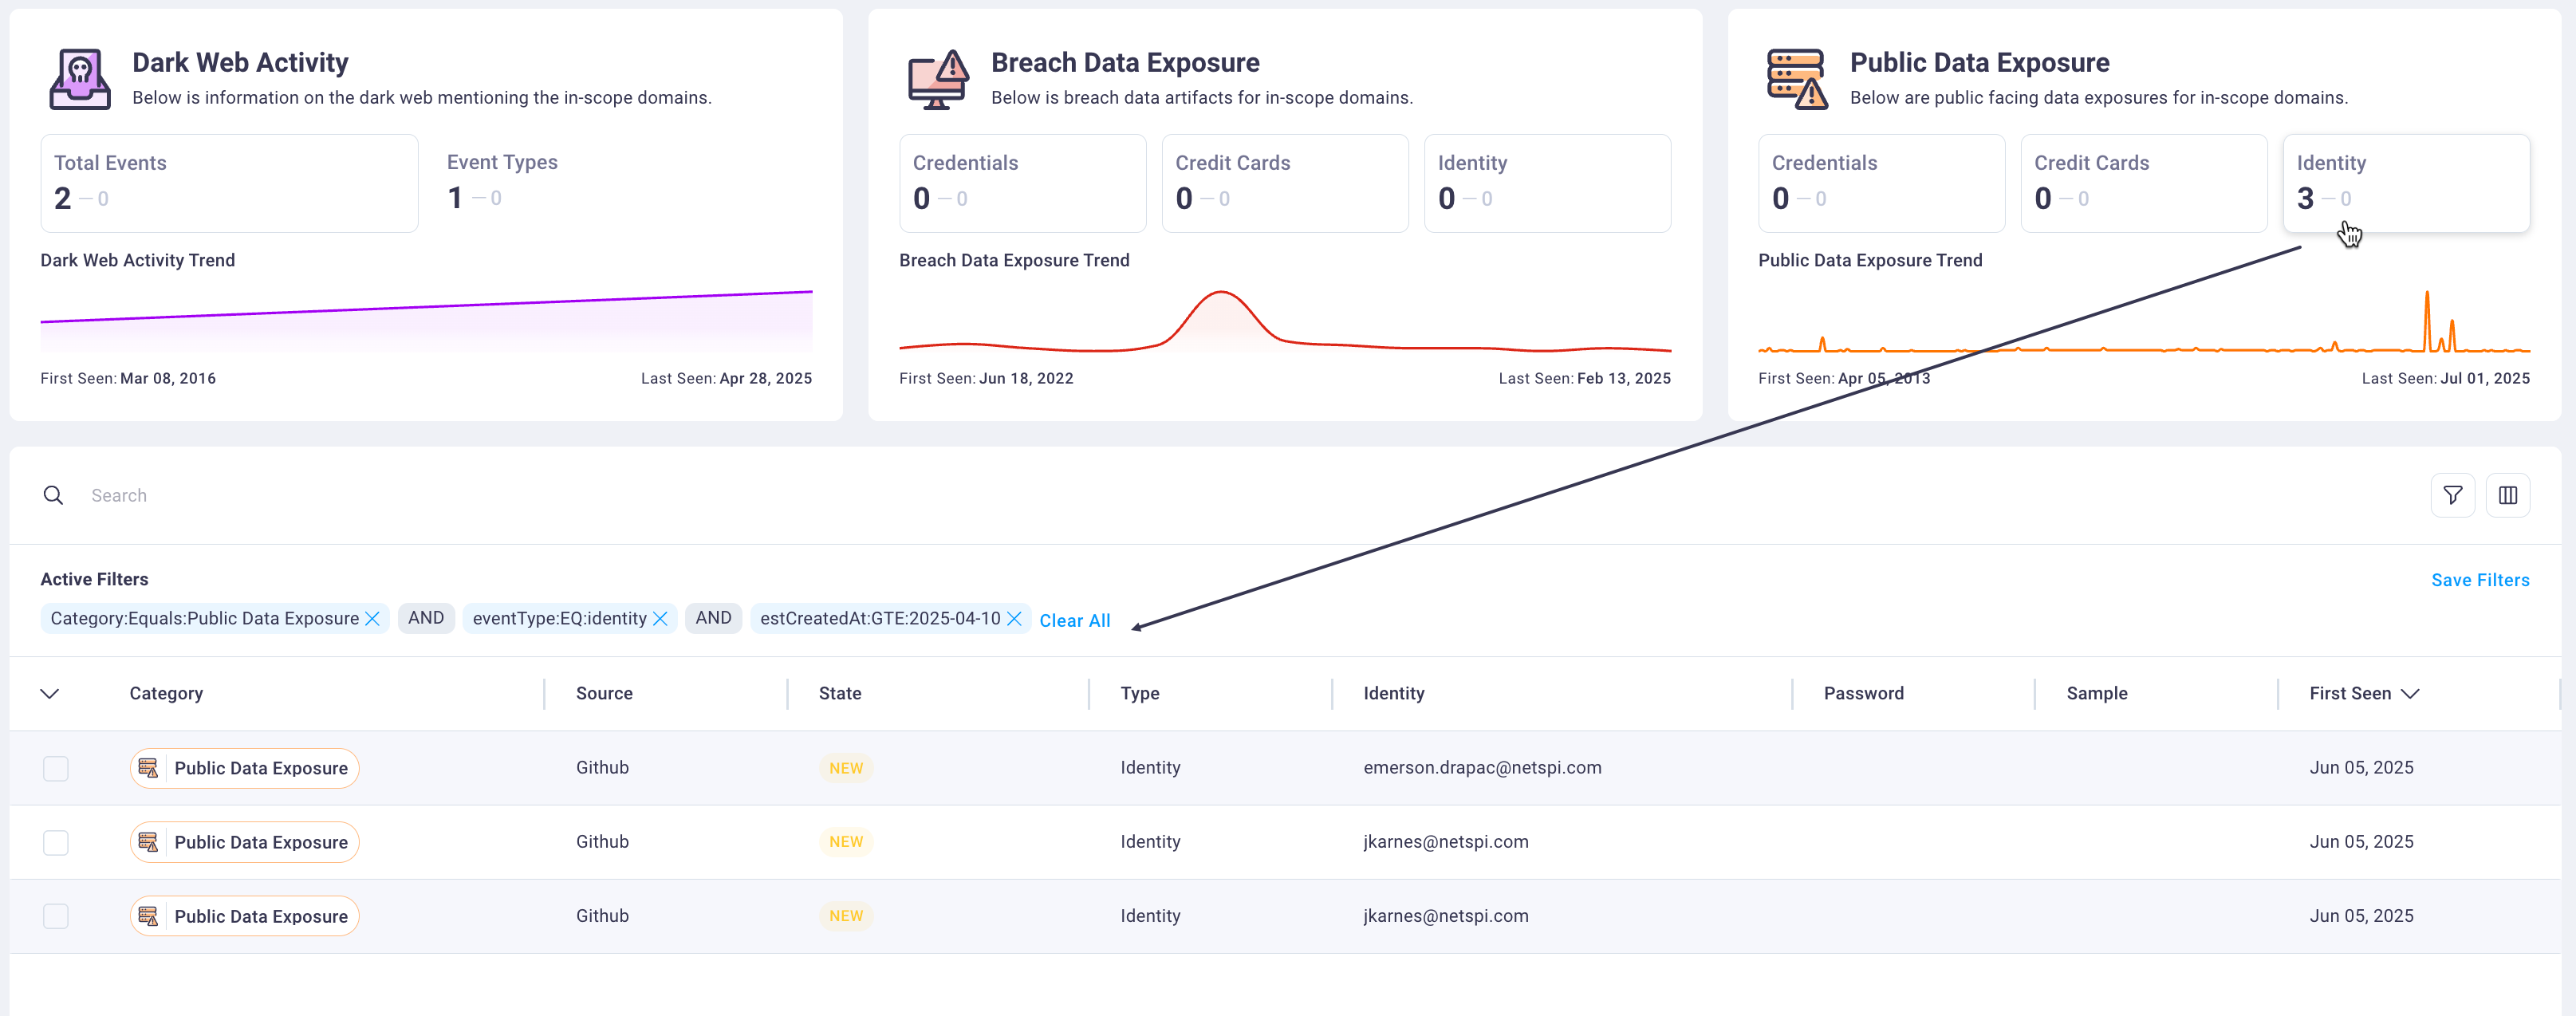
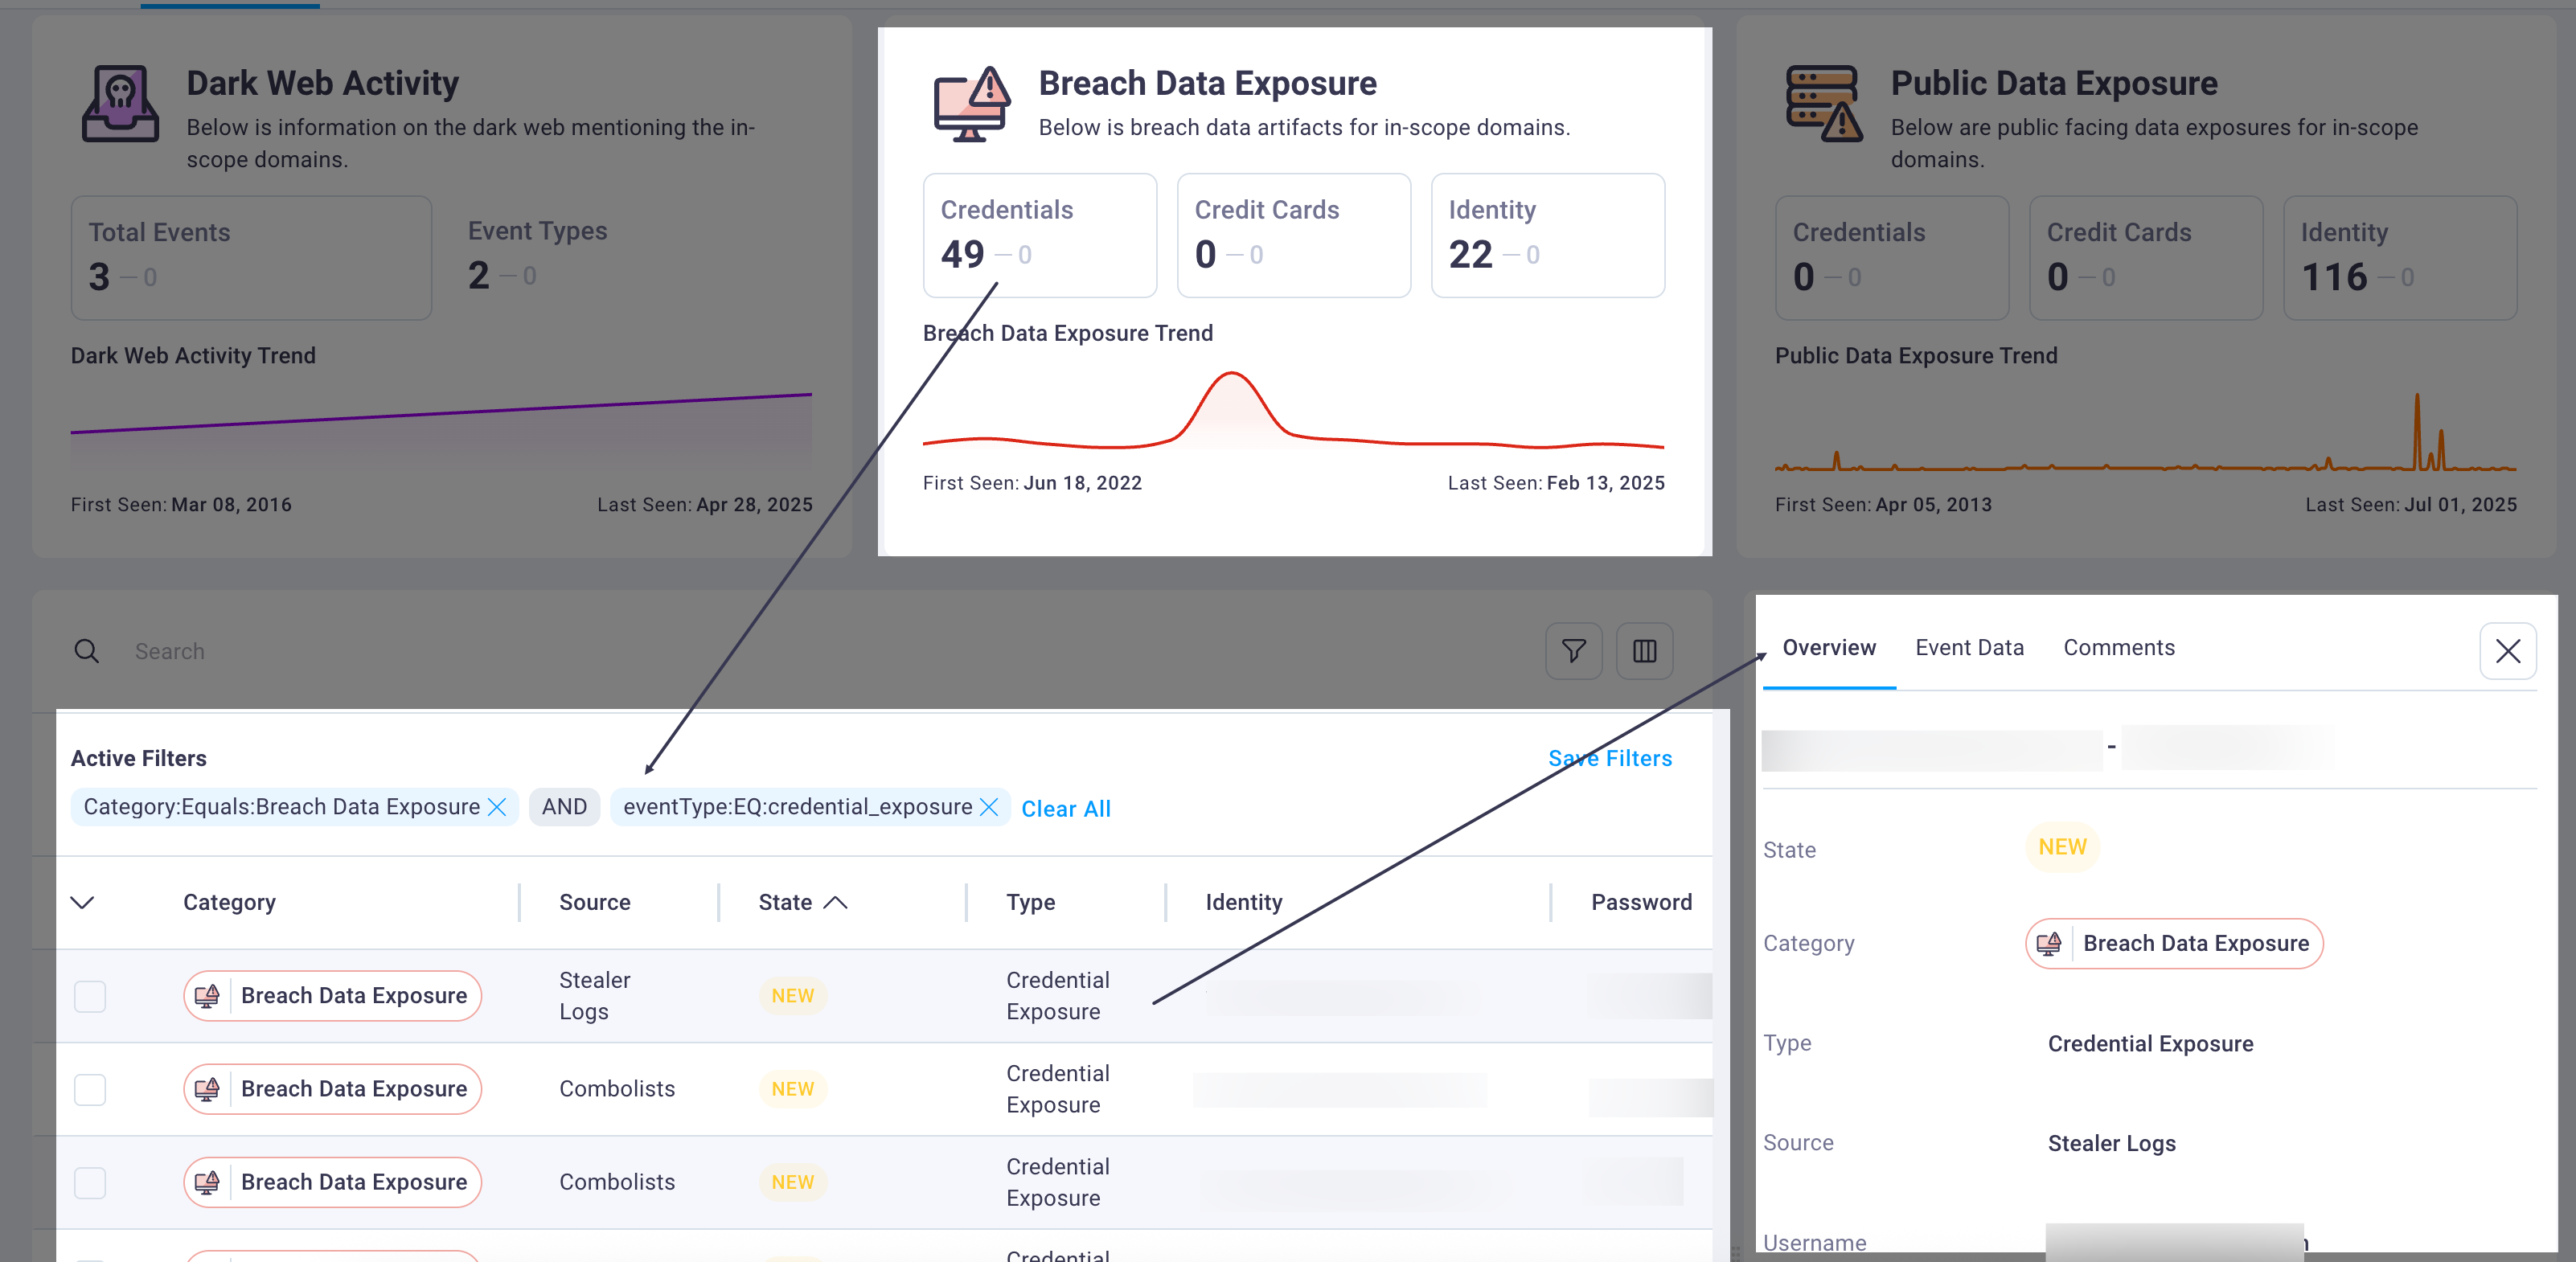
Each card displays the total count of threats detected within your selected time period. Selecting any bordered card within the threat summary sections automatically filters the detailed events table below to display only threats matching the selected category. Clicking the same card again clears the filter and returns the table to its full view.
The exposure category cards include visual indicators and support click-through functionality that enables rapid threat categorization and investigation workflow management.
#
4. Detailed events table
The detailed events table presents comprehensive information for each detected threat, including exposure categories, current investigation status, technical details, and source information. The table supports advanced sorting, filtering, and search capabilities to enable efficient threat triage and investigation workflows.
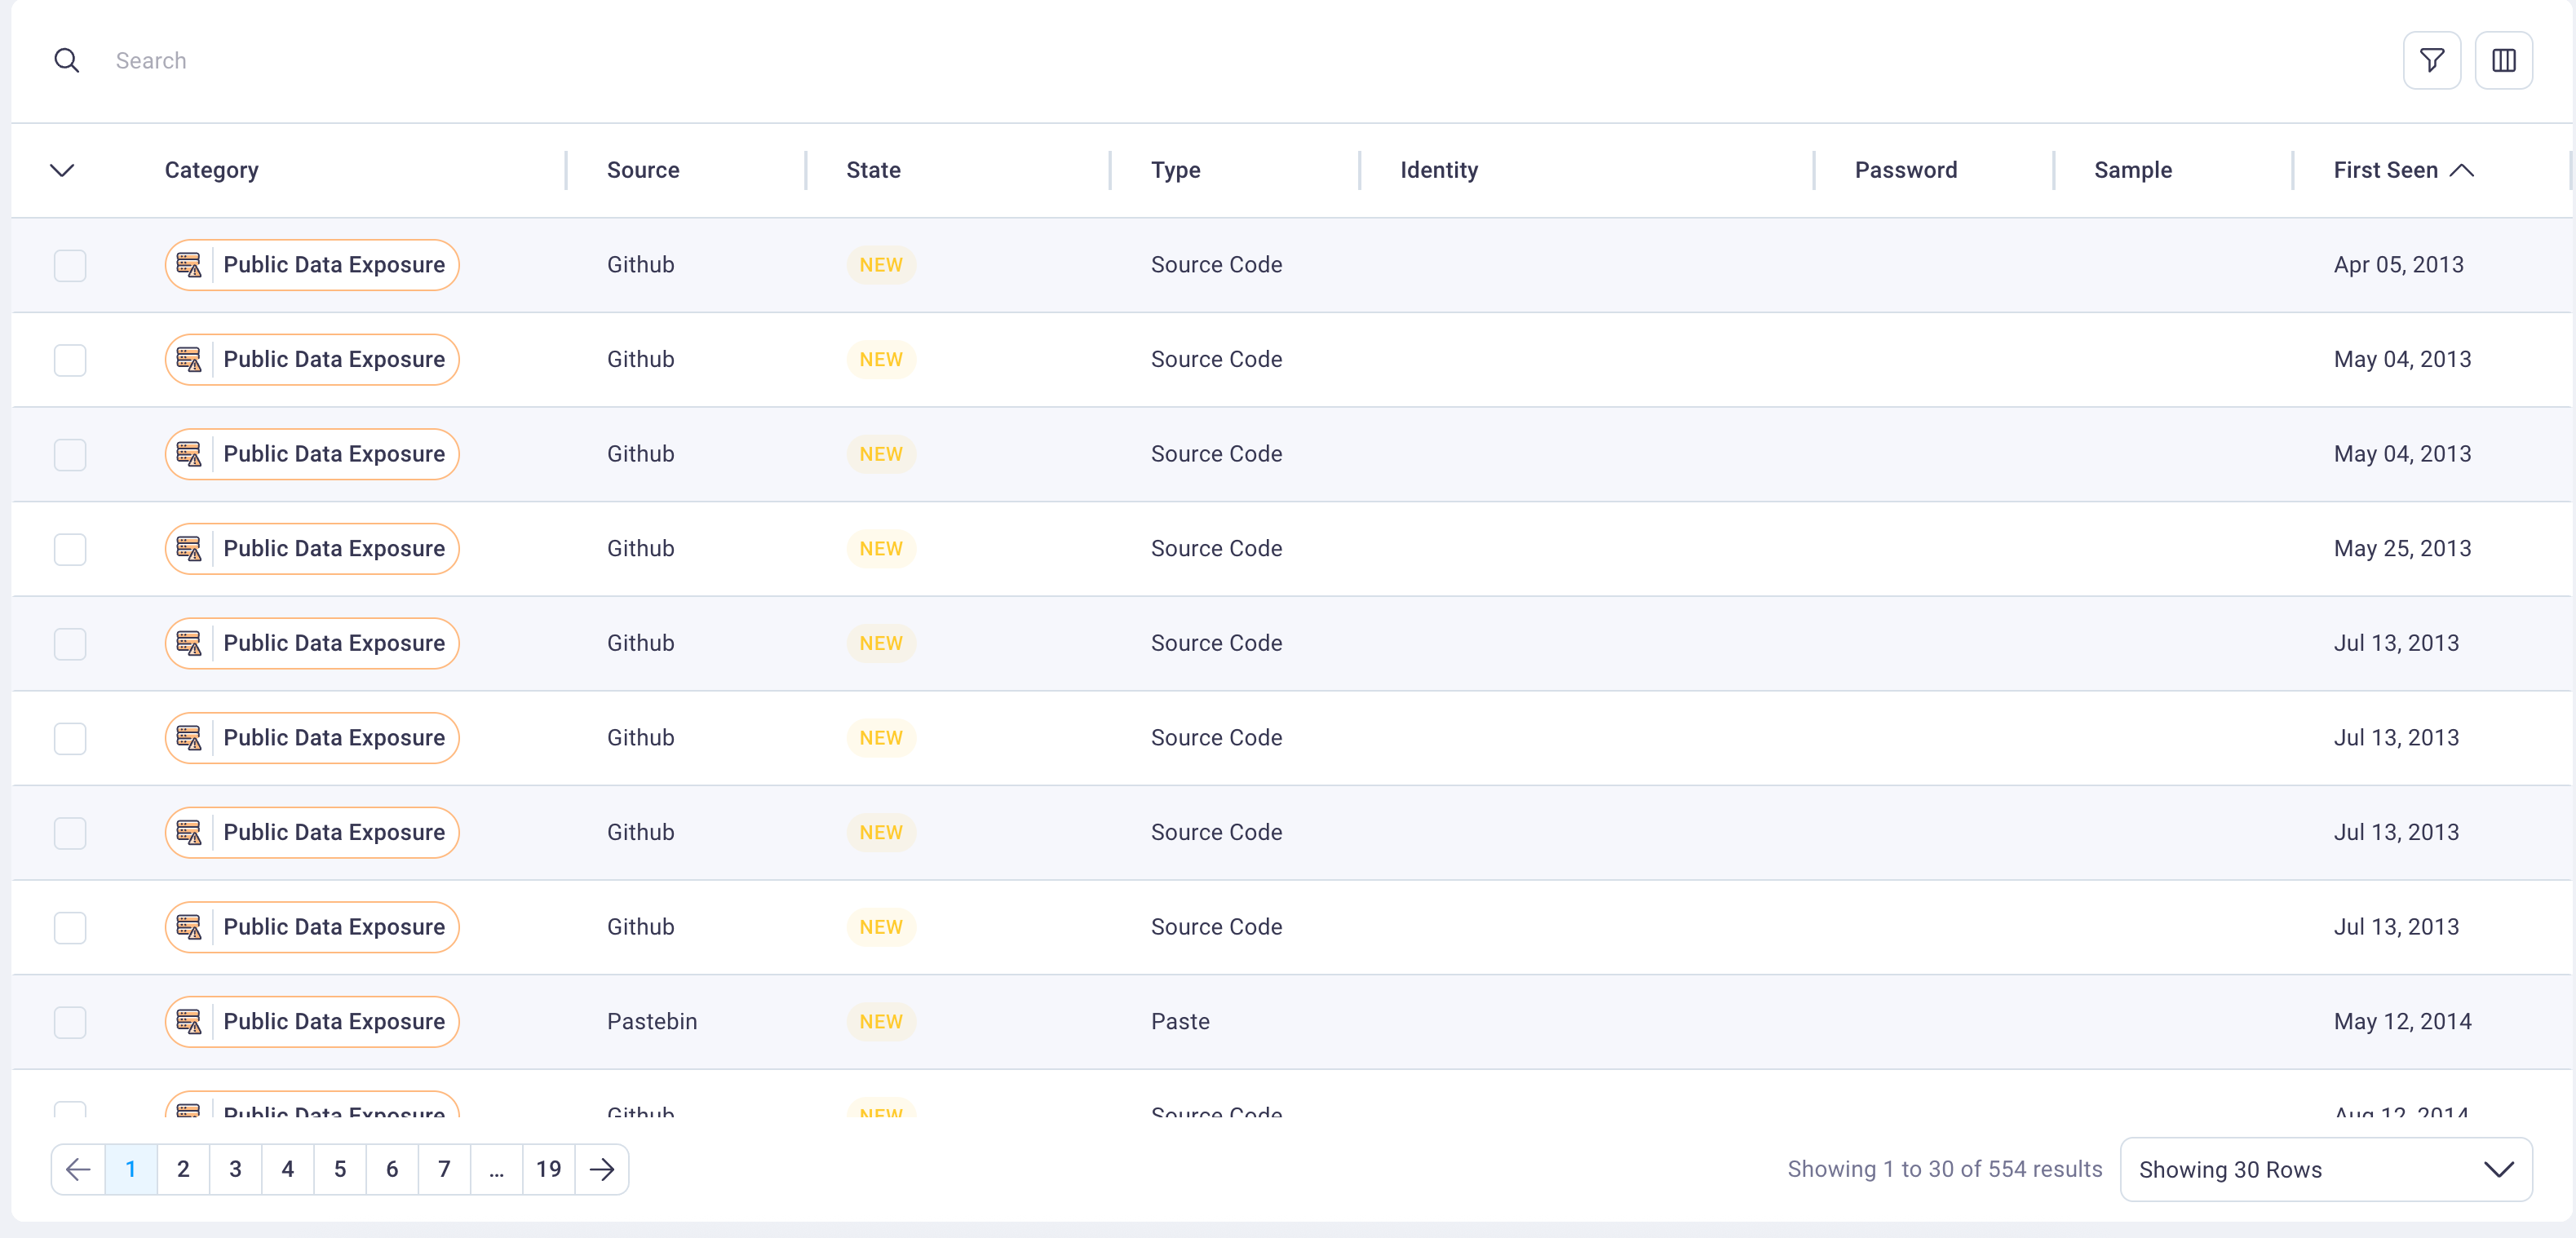
The table includes specialized category badge components that provide visual indicators for threat types including Credentials, Personal Identifiable Information (PII), and Identity exposures. Each row represents a unique threat event with complete contextual information for security analysis.
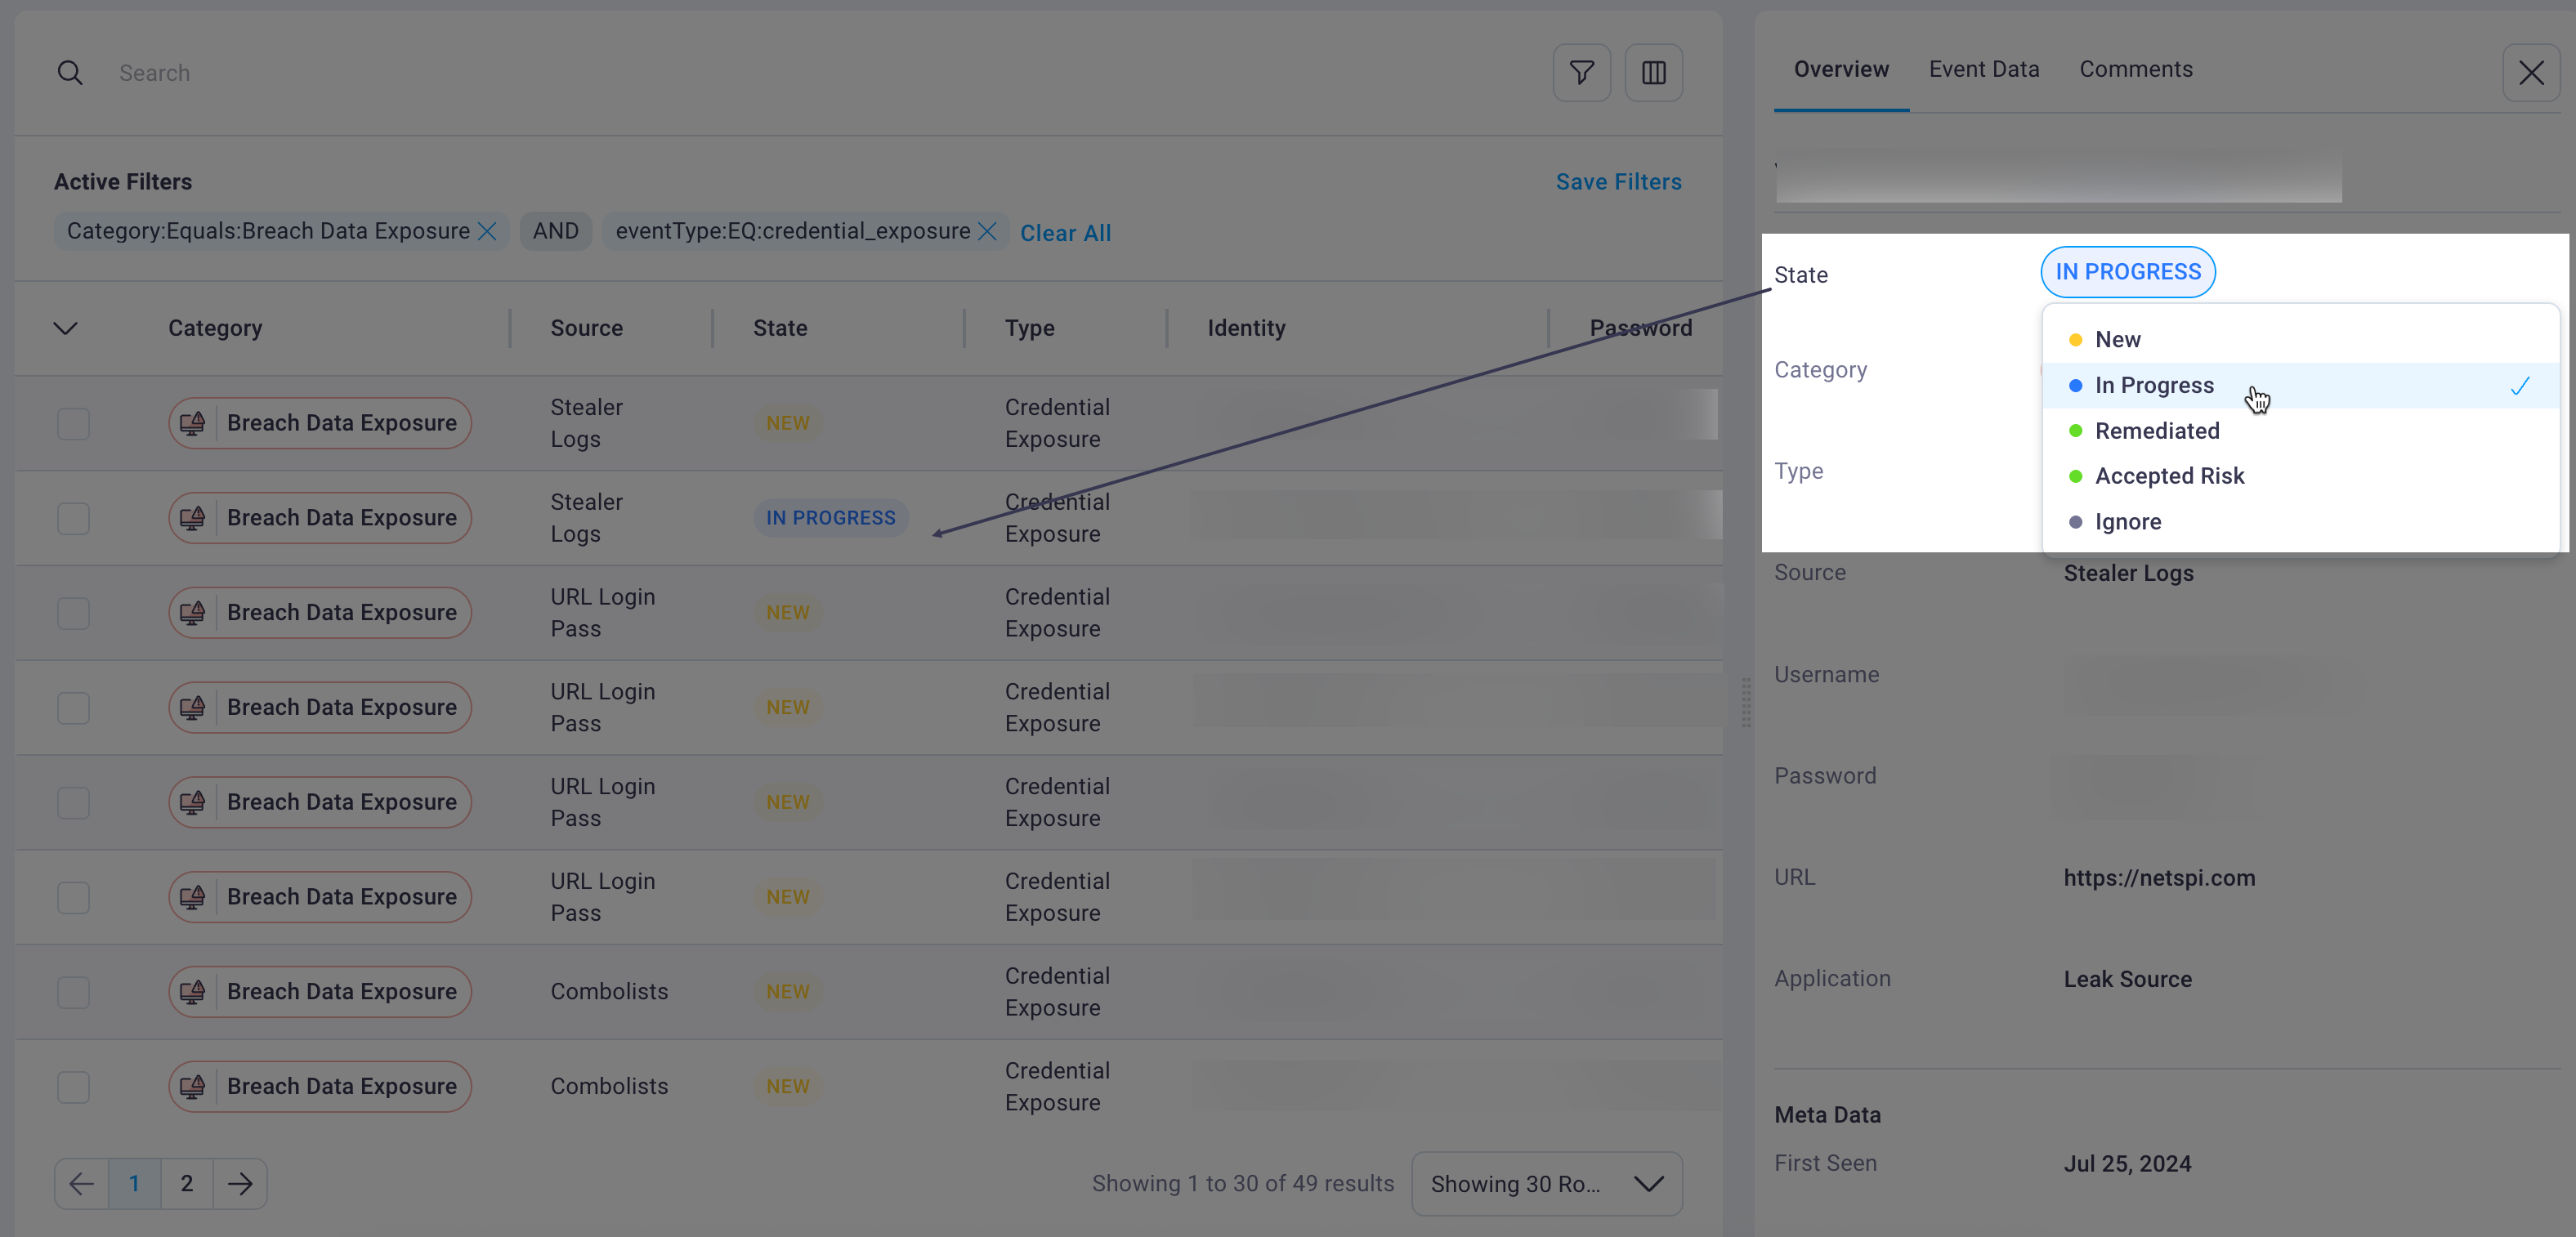
The table automatically sorts events by status column with the following priority order: New, In Progress, Remediated, Accepted Risk, and Ignore. This default sorting ensures that newly discovered threats requiring immediate attention appear at the top of the investigation queue.
You can take the following actions from the events table:
- Search across all event data using the search functionality
- Filter events by specific criteria including threat type, status, and source
- Configure which columns display in the table view using the column configuration options
- Export selected events or complete datasets using the comprehensive data export functionality
- Adjust the number of rows displayed per page for optimal workflow management
#
Status workflow management
The Dark Web dashboard implements a comprehensive status workflow system that enables tracking of threat events from initial discovery through complete remediation. Each event can be assigned one of five status levels that reflect the current state of investigation and response:
New: Recently discovered threats that require initial security assessment and prioritization. These events appear at the top of the sorted table view to ensure immediate attention.
In Progress: Threats currently under active investigation or remediation by security teams. This status indicates ongoing work and prevents duplicate effort across team members.
Remediated: Completed incidents where the identified threat has been successfully addressed and no longer poses risk to the organization.
Accepted Risk: Threats that have been evaluated and determined to be acceptable risks based on organizational risk tolerance and compensating controls.
Ignore: Events determined to be false positives, duplicate entries, or otherwise non-actionable threats that should be excluded from active monitoring.
#
5. Event investigation panel
The event investigation panel provides detailed information for selected events through a convenient side panel that opens when you select any row in the detailed events table.
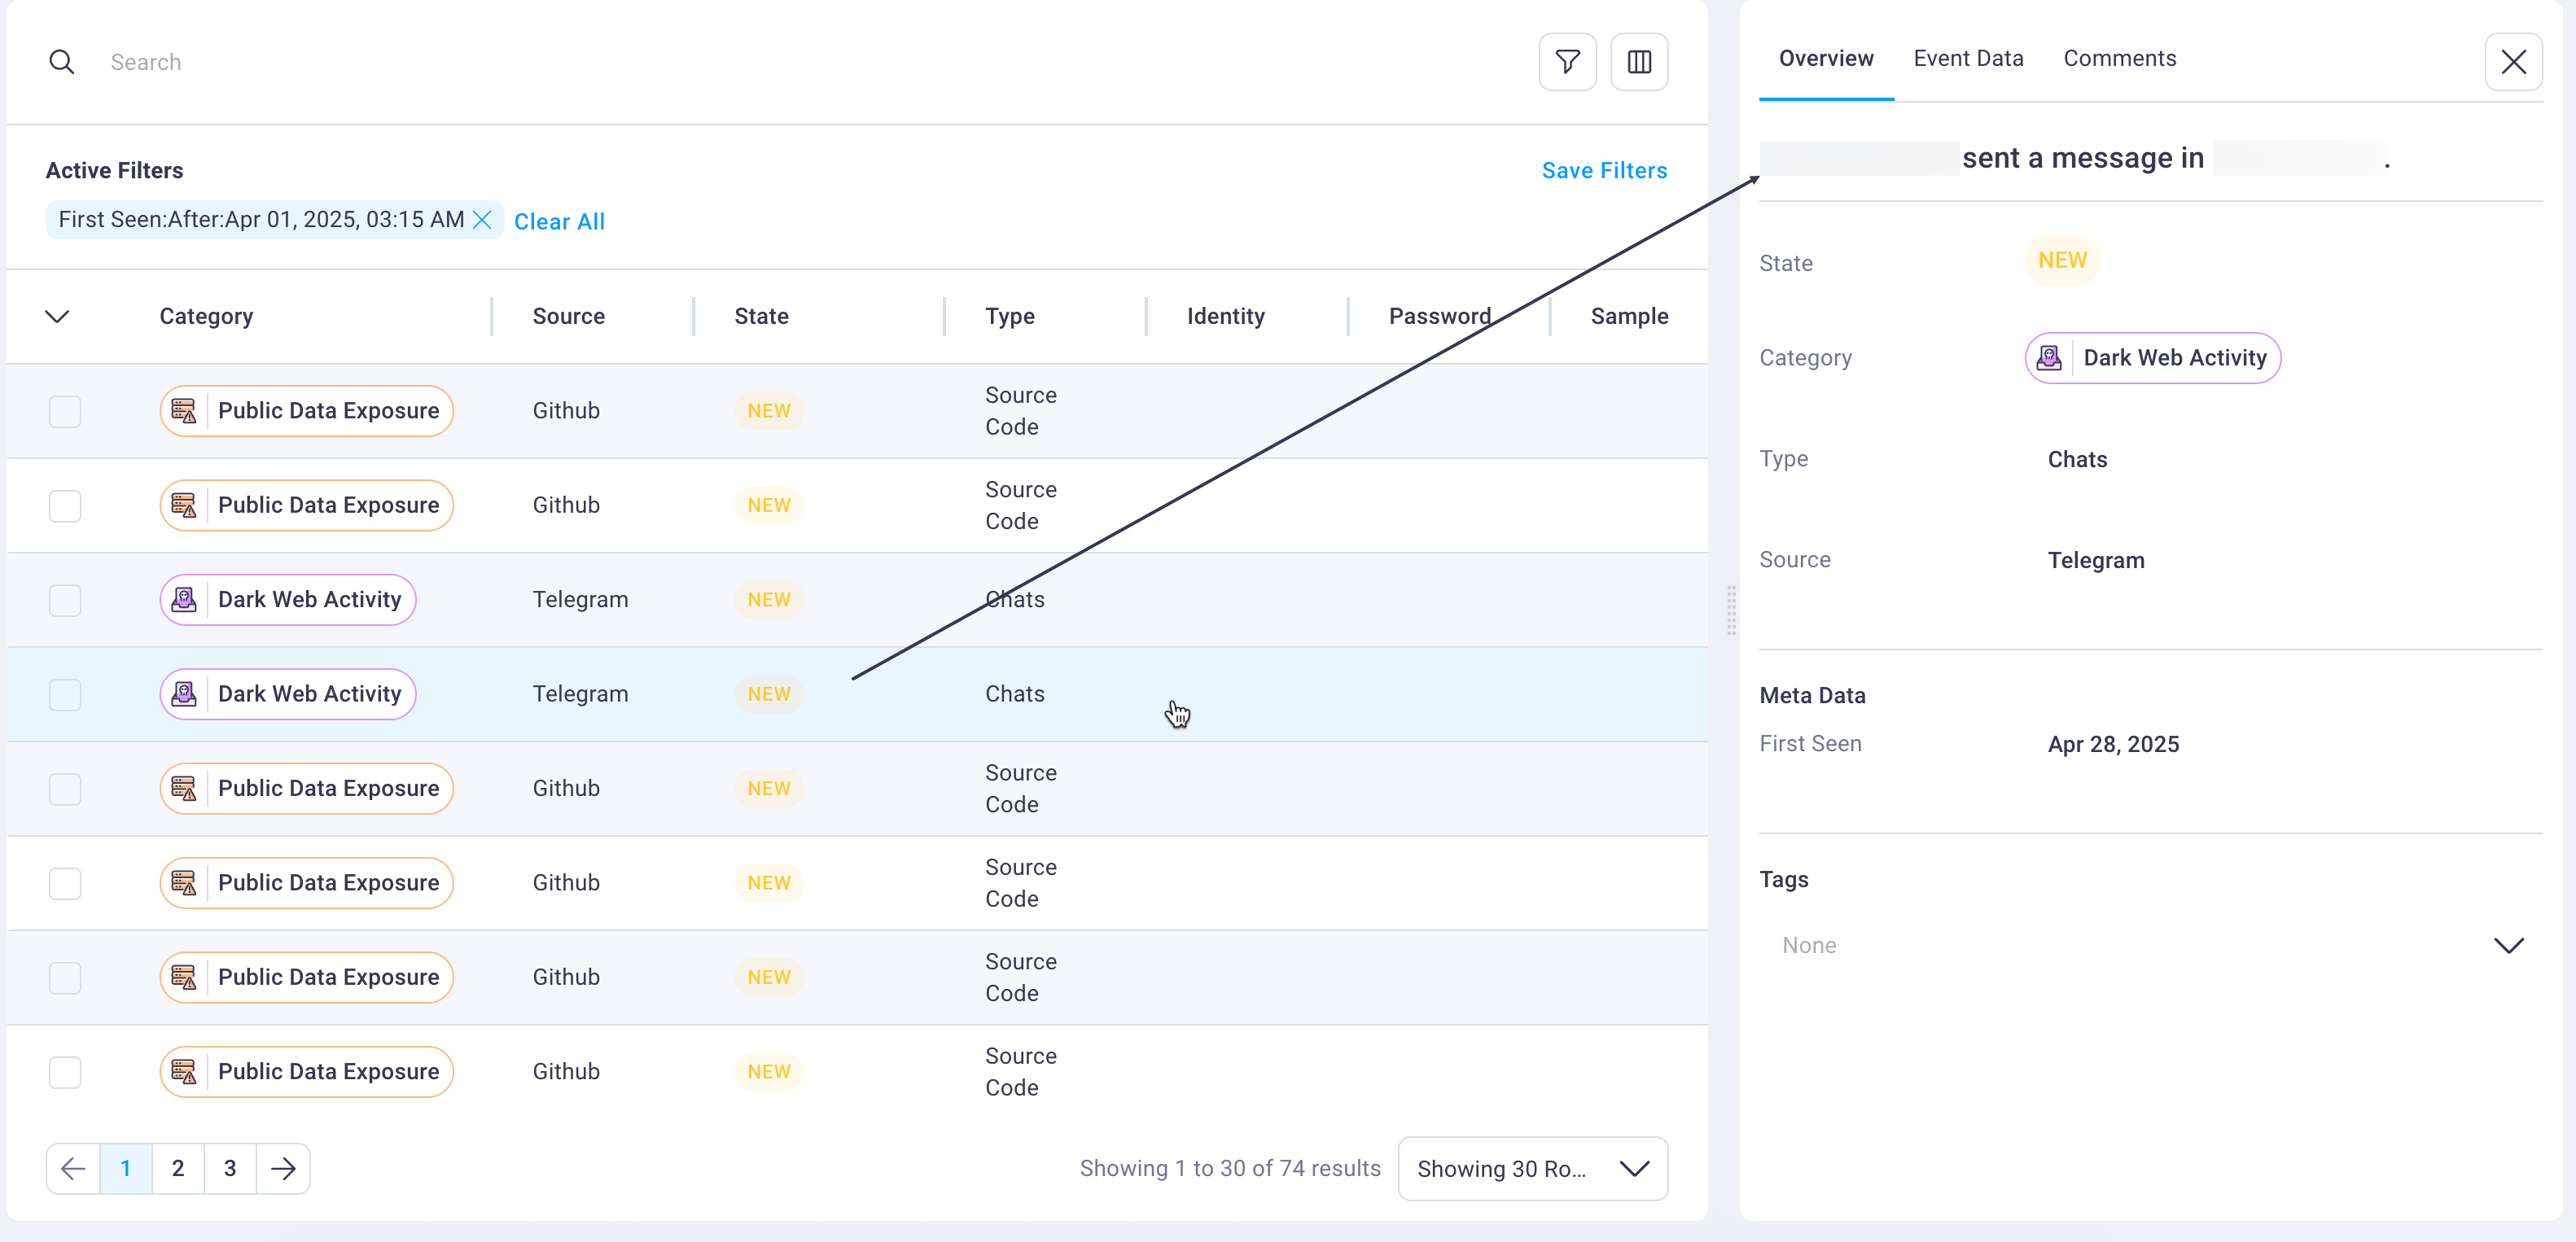
This panel displays comprehensive event details organized across three specialized tabs to support thorough investigation and collaborative response workflows for comprehensive threat analysis.
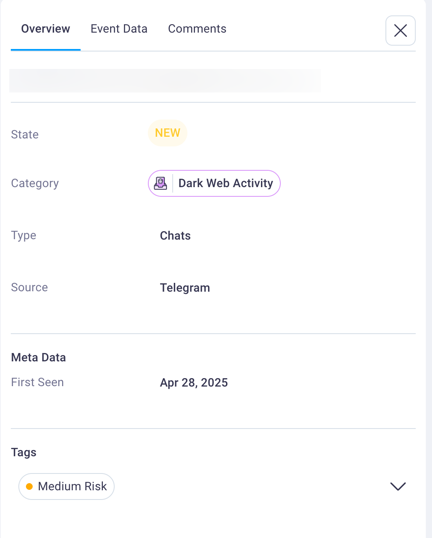
Overview tab: Displays essential event details including the exposure category (such as Public Data Exposure), current investigation state (New, In Progress, Remediated, Accepted Risk, or Ignore), threat type (Source Code, Forum Posts, etc.), source platform (GitHub, Exploit.IN, etc.), metadata including first seen date, and any custom tags applied by users for organizational tracking.
Event Data tab: Provides access to the complete technical event information including raw event data and event header data in JSON format.
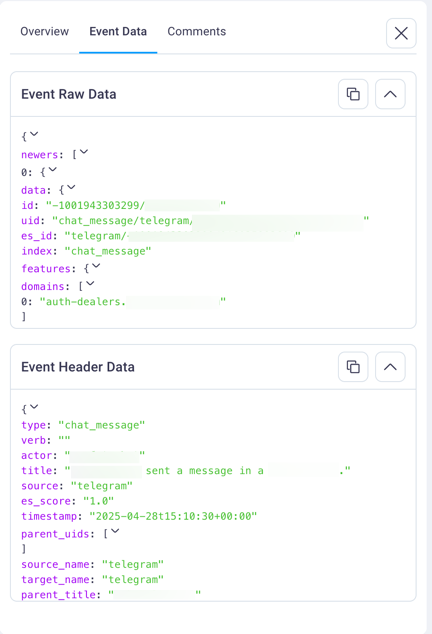
Both data sections include convenient copy icons that enable quick copying of technical details for further analysis or integration with other security tools.
Comments tab: Enables collaborative investigation documentation where team members can add comments, observations, and investigation findings to specific events.
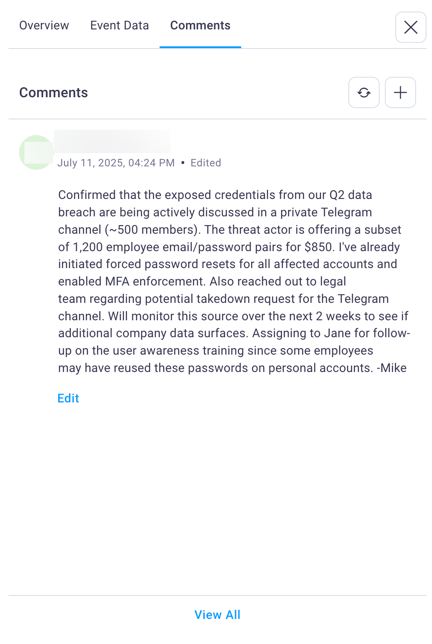
This tab also displays comments from other team members, supporting coordinated response efforts and knowledge sharing across security teams.
#
Getting started with Dark Web monitoring
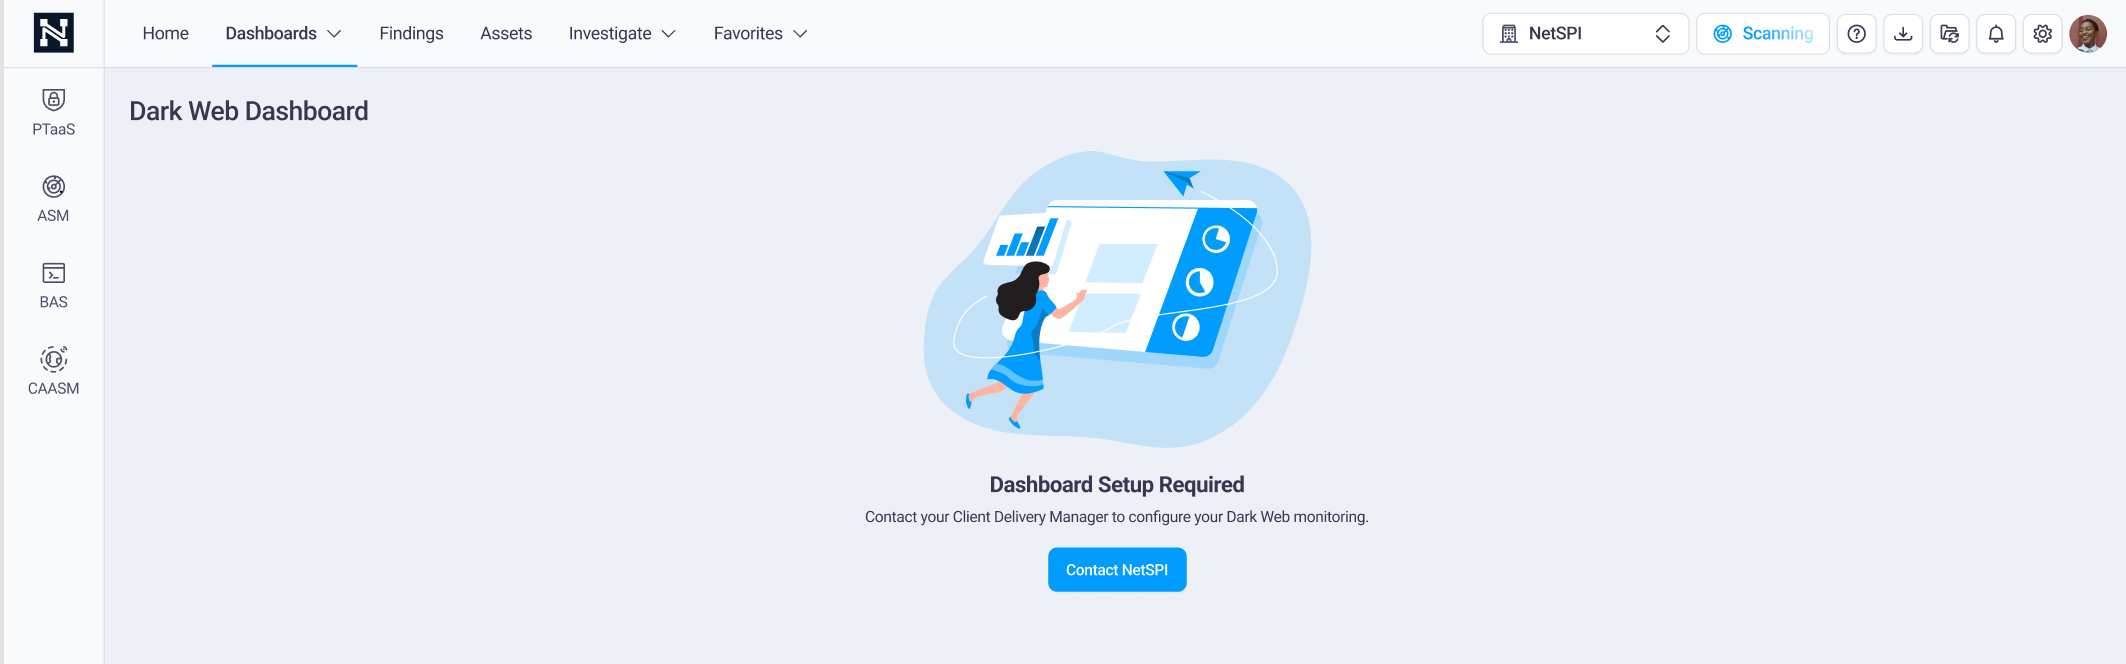
Access the dashboard: Navigate to the Dark Web dashboard by selecting the top navigation's Dashboards drop-down list and select Dark Web to display the Dark Web dashboard.
Note
If your organization is not yet configured for Dark Web monitoring, select the Contact NetSPI button that displays on the Dashboard Setup Required page that displays.
Review time settings: Examine the current time range setting and adjust if needed to focus on your preferred analysis period. The default "All Time" view provides the most comprehensive threat landscape overview.
Analyze threat summary: Review the threat summary cards to understand current exposure levels across dark web sources, breach databases, and public data platforms.
Investigate priority threats: Focus on events with New status in the detailed events table, as these represent recently discovered threats requiring immediate security assessment.
Use investigation tools: Select specific events to access detailed technical analysis, add investigation notes, and coordinate response efforts using the investigation panel.
Track remediation progress: Update event status State as investigations progress and remediation actions are completed to maintain accurate threat tracking.
#
Best practices for Dark Web monitoring
Regular monitoring of the Dark Web dashboard enables proactive threat detection and response.
- Check the dashboard frequently to identify new threats before they escalate into security incidents.
- Prioritize events by status, focusing first on newly discovered threats that require immediate attention.
Document investigation findings and remediation actions using the collaborative comments feature to maintain institutional knowledge and enable effective team coordination. Update threat status consistently as investigations progress to ensure accurate tracking of organizational security posture.
Use the time-based filtering capabilities to analyze threat patterns and identify trends that may indicate increased risk or successful security improvements. Export threat data regularly for integration with other security tools and for compliance reporting requirements.
The technical event analysis tools provide deep insight into threat attribution and technical indicators, enabling more effective threat hunting and security control validation across your organization's digital infrastructure.