#Finding Trend dashboard

The Finding Trend Dashboard displays multiple views of your organization’s findings.

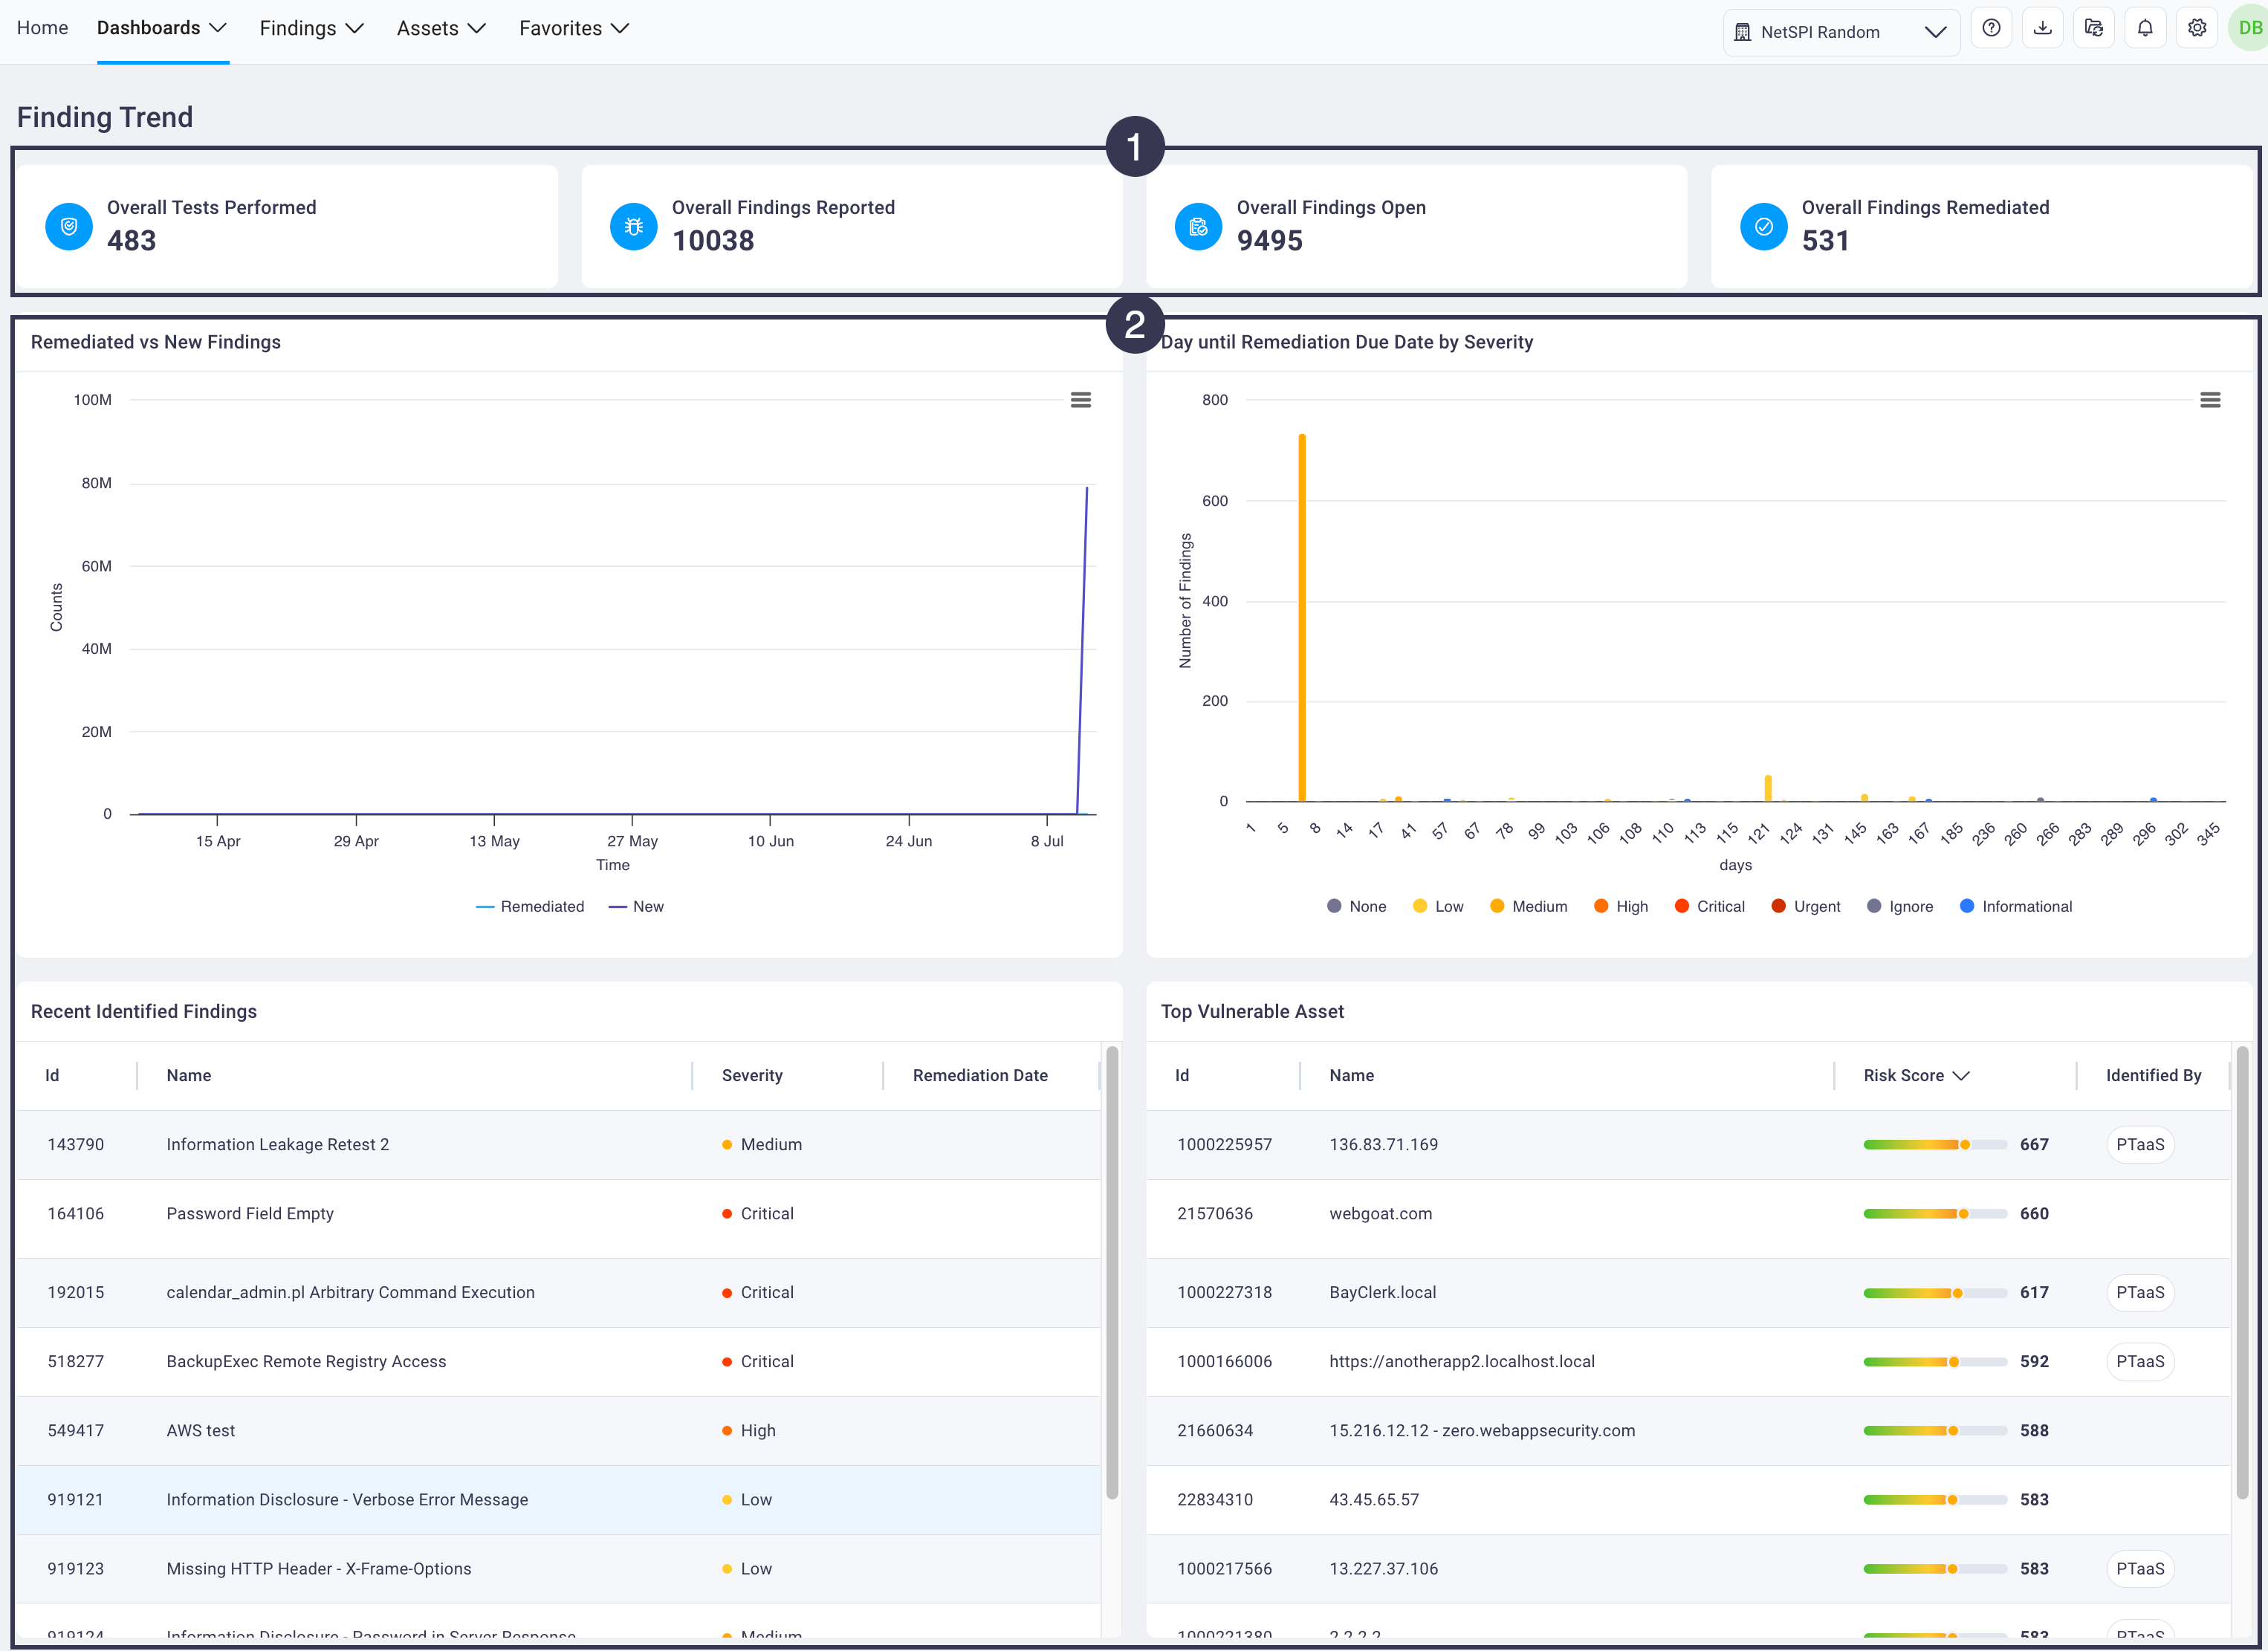
#1. Overall tests and findings information

The top-level cards display selectable data about the overall test performed and reported, open, and remediated findings.

Finding trend dashboard

The table below describes what you see when you select each of the Finding cards.

Finding CardDisplays the Findings page with this information:
Overall Tests PerformedAll of your organization's findings across all engagements
Overall Findings ReportedAll of your organization's published findings across all engagements with a filter of "published = true" applied to the findings
Overall Findings OpenAll of your organization's published findings across all engagements with a filter applied to not display any findings in a state of remediated, accepted risk, exception granted, or false positive
Overall Findings RemediatedAll of your organization's published findings across all engagements with a filter applied to display any findings with a remediation due date of the current date or earlier

#2. Finding trend dashboards

Scroll down beneath the Finding Trend cards to view a series of 10 finding dashboards that provide targeted views into your findings. For almost every finding dashboard you can select the hamburger button to display a menu of actions.

Further action
Further action

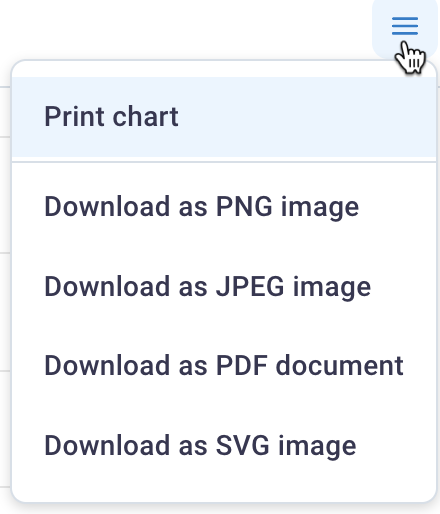
  • Print the dashboard chart
  • Download an image of the dashboard (PNG, JPG, PDF, and SVG are options)

The following available finding dashboards are described below.

DashboardType of finding information/actions
Remediated vs New FindingsThis displays a line chart showing the total finding count broken out by those findings that are remediated and those that are new.

  • Hover over a line to view the total count of new and remediated findings for that specific date.
  • Select a "new" or "remediated" line to display the Findings page with published findings that are either new or remediated for that date.

Finding trend remediated vs new
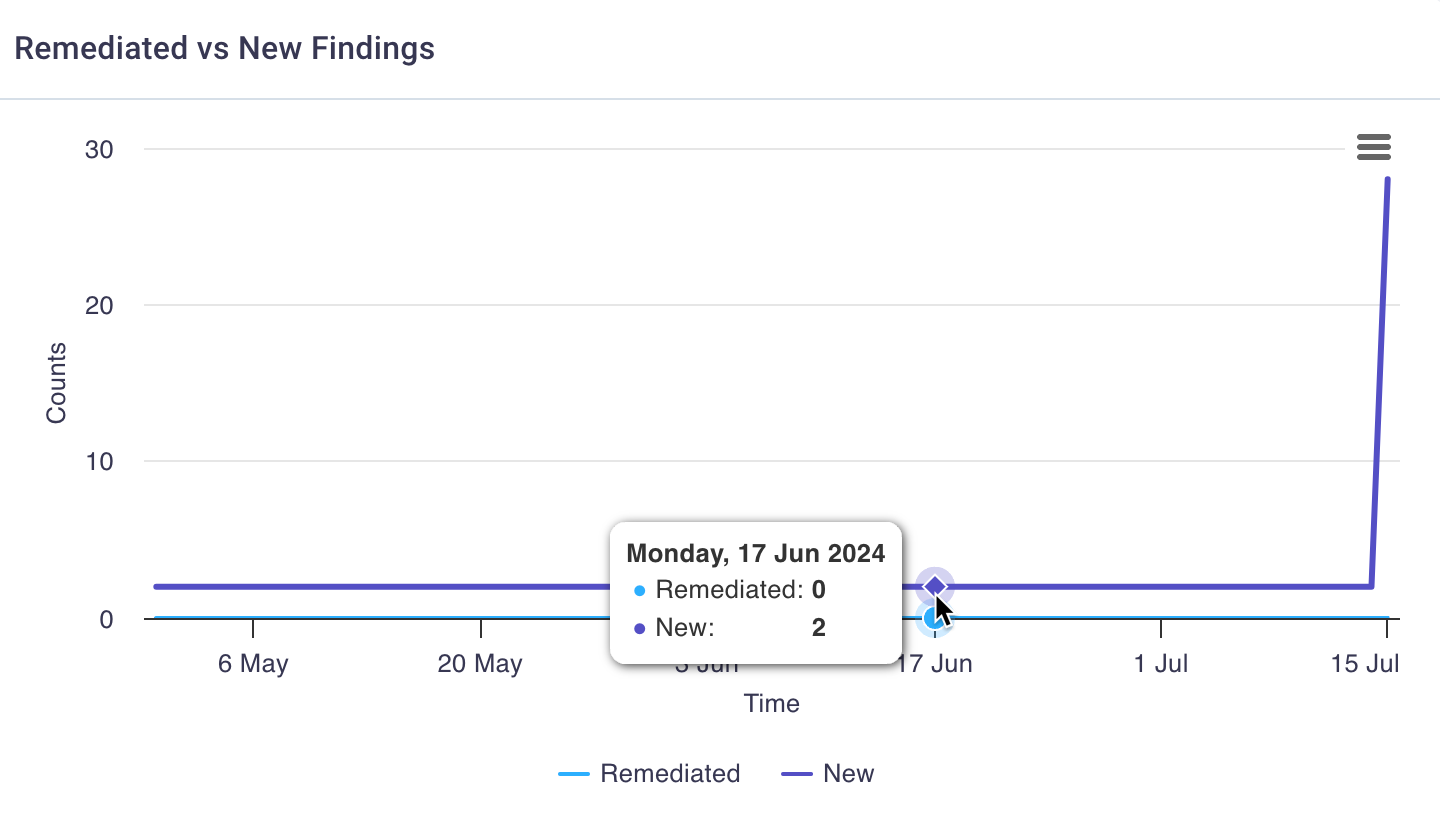
Day until Remediation Due Date by SeverityThis displays a bar chart showing findings grouped by remediation due date and finding severity category.

Selecting a bar on the chart displays the Findings page displaying all findings that match the selected remediation due date and severity category.
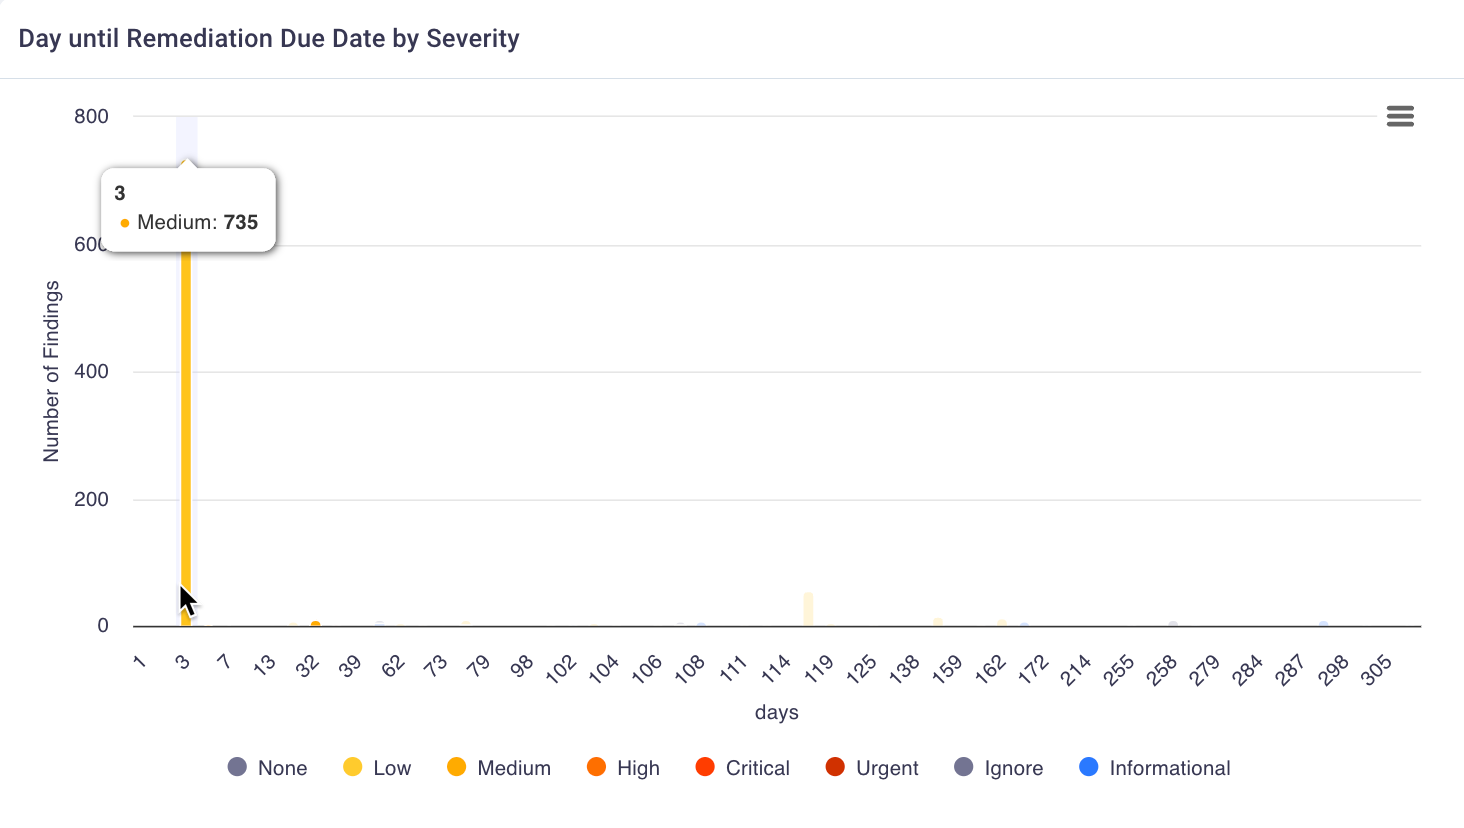
 Days to remediation
Recent Identified FindingsThis displays a sortable, scrollable table of your most recent findings.
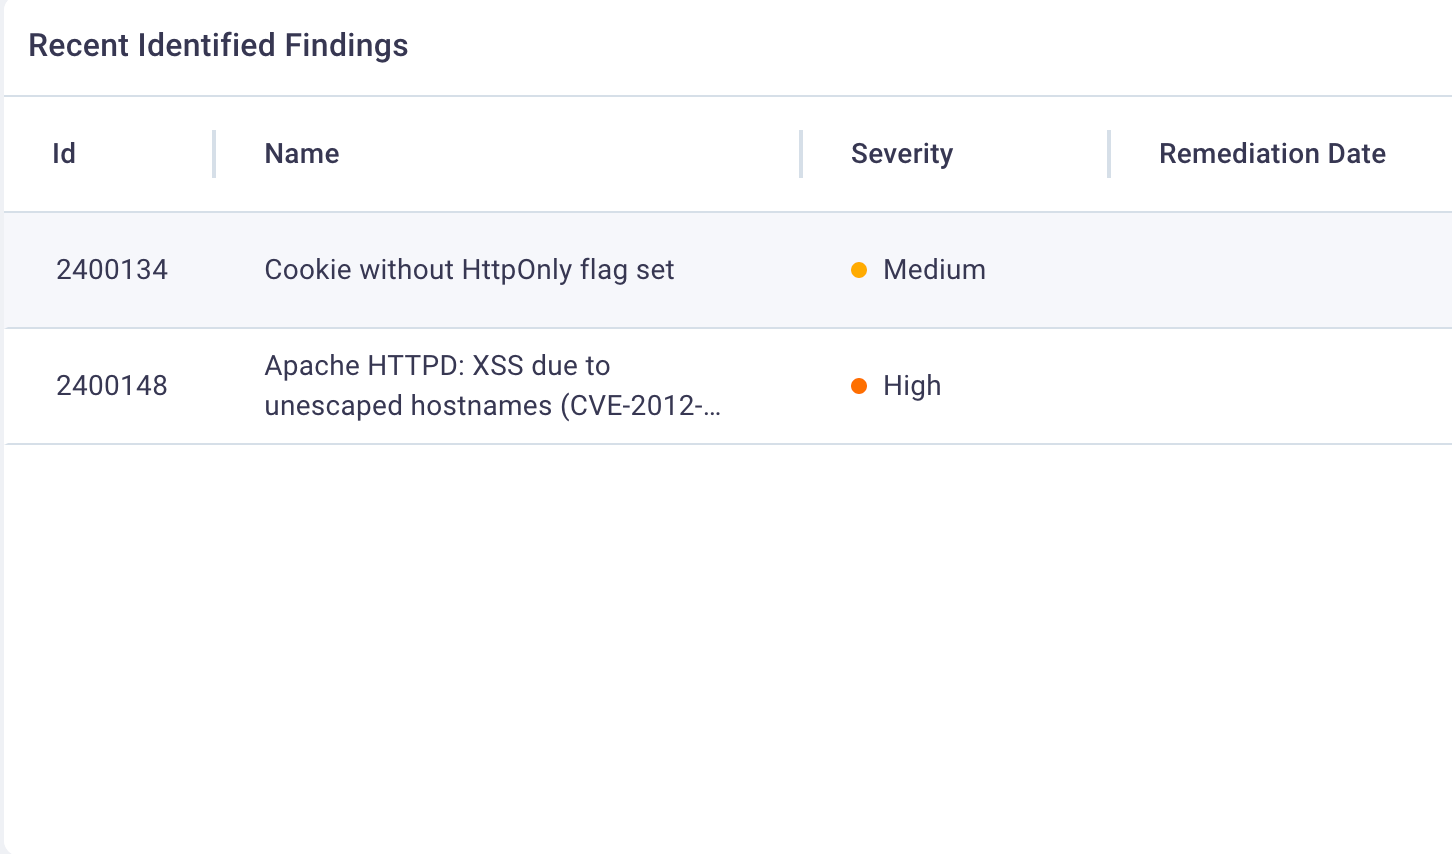
  • Select the table any table heading to sort the findings to help locate those that most urgently need addressing.
  • Select any table row to display the finding details page for the finding.
Recent ID findings
Top Vulnerable AssetThis displays a table sorted to show your organization's asset with the highest risk score rating.

Select any row to show the Asset Details page for the selected asset.
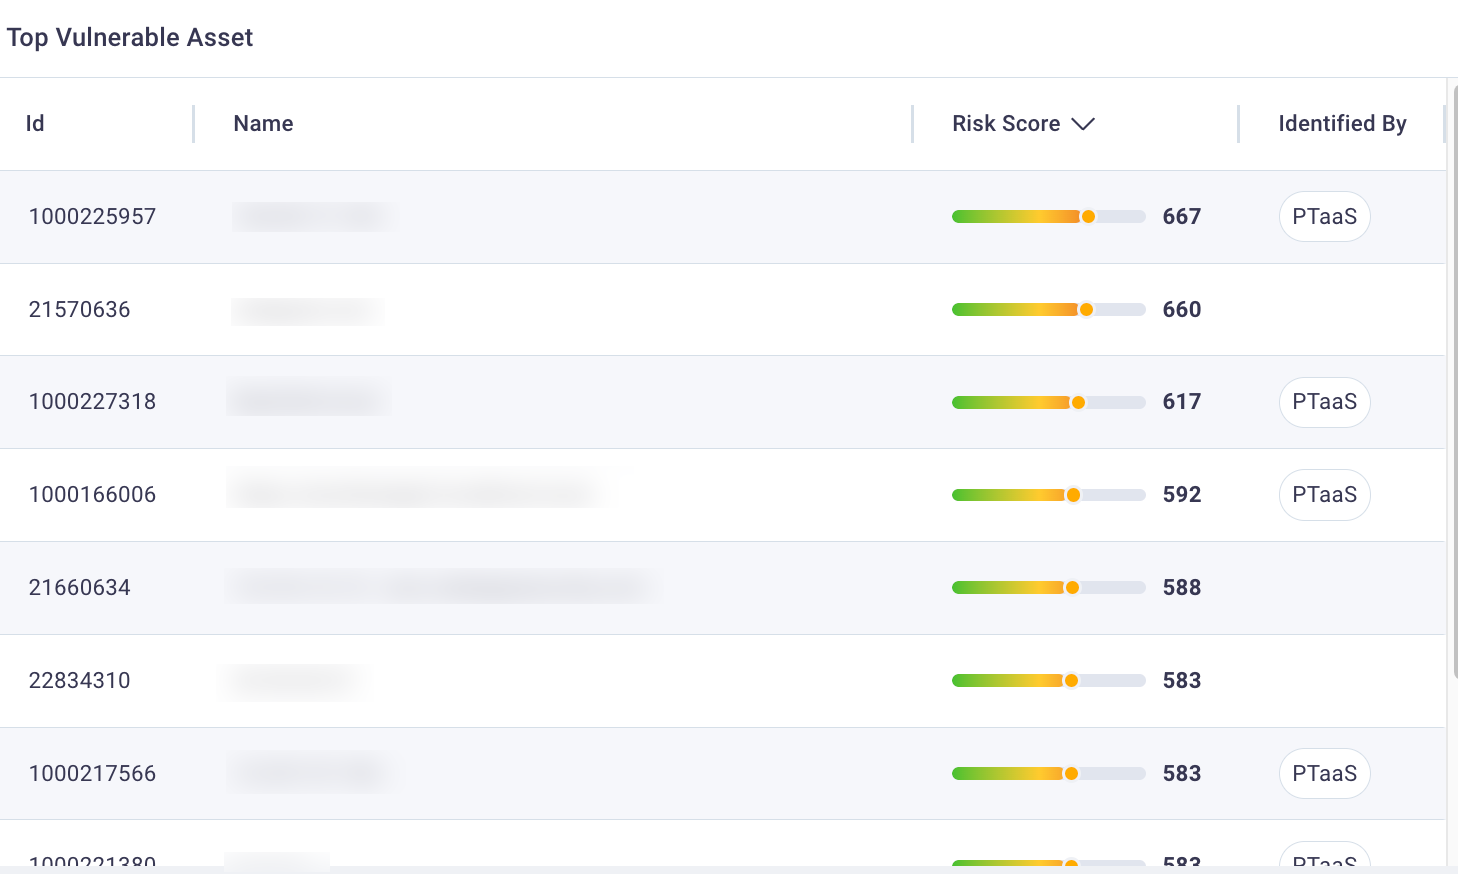
 Top vuln asset
Findings by Status and SeverityThis displays a bar chart by finding state; within each state column is a color coded number of findings by severity state.
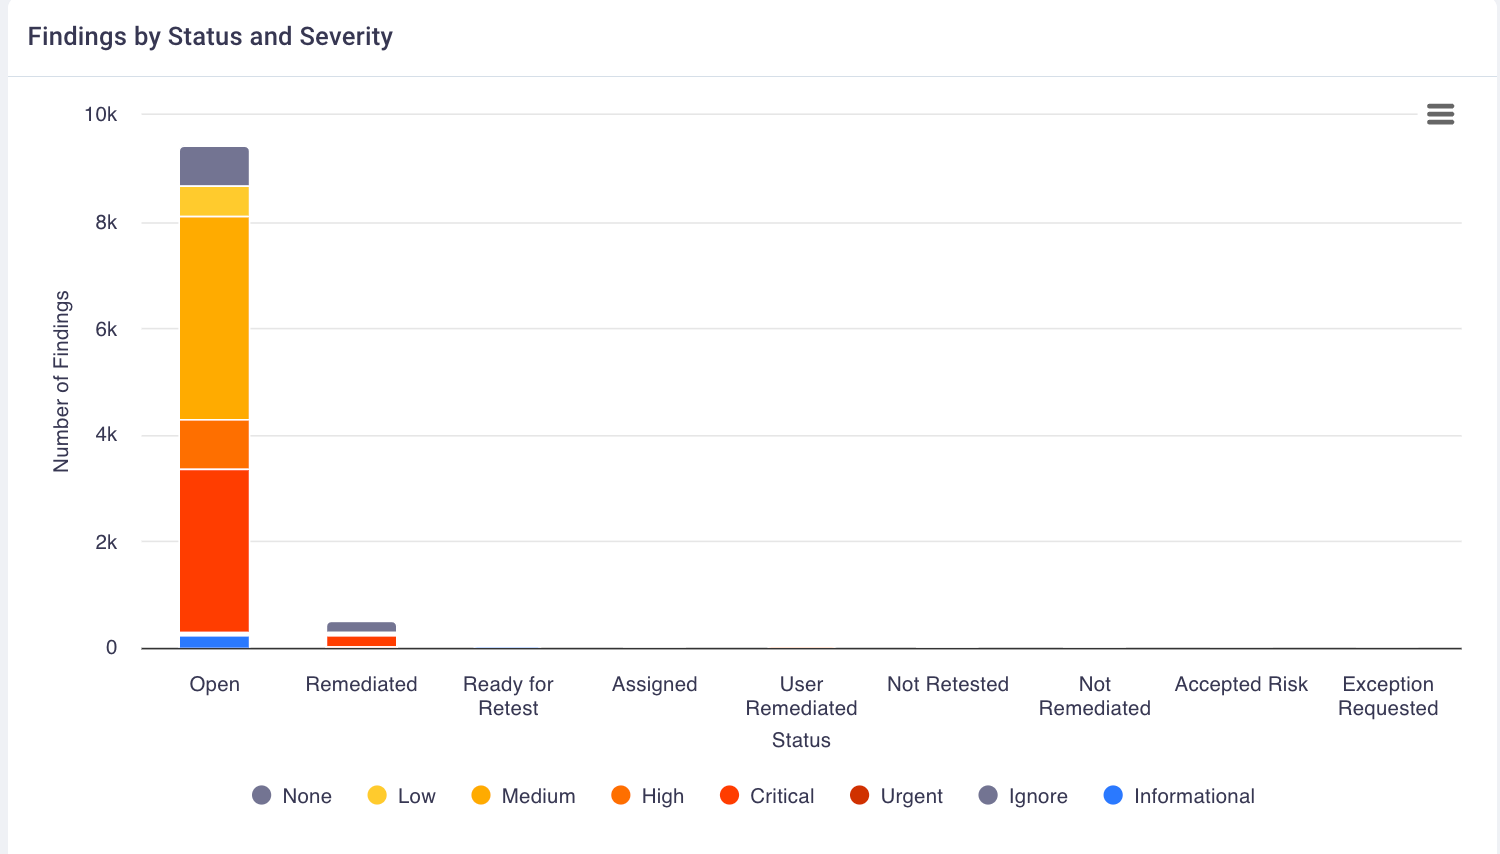
  • Hover over each of the bars to view a count of the number of findings per severity level
  • Select a specific severity state on a bar to display the Findings page with a table filtered to reflect that severity state for published, non-remediated findings.
Findings by stat and severity
Remediated vs Not Remediated FindingsThis displays a bar chart of all findings, both remediated and those that are not yet remediated.
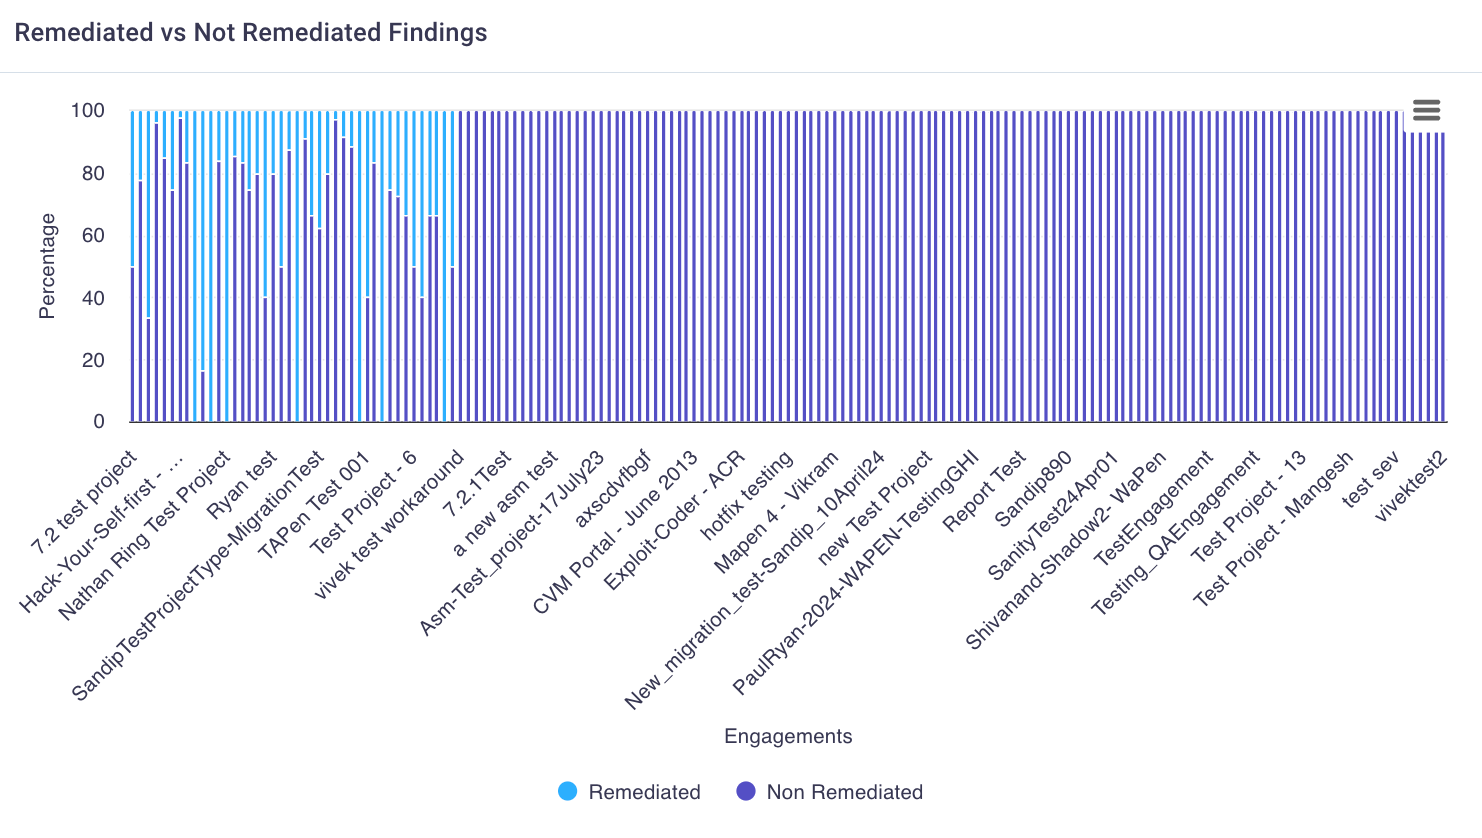
  • Hover over either the Remediated or Non Remediated bar in the chart to view the number of findings in that state
  • Select either bar to display Findings page with a table filtered to display the published findings that are either remediated (or not) based on your selection. Selecting any of these rows displays the finding details for the selected finding.
Rev vs non-rem findings
All Findings by Engagement and SeverityThis displays a bar chart of all your organization's engagements; within each engagement column is a color coded number of findings by severity state.
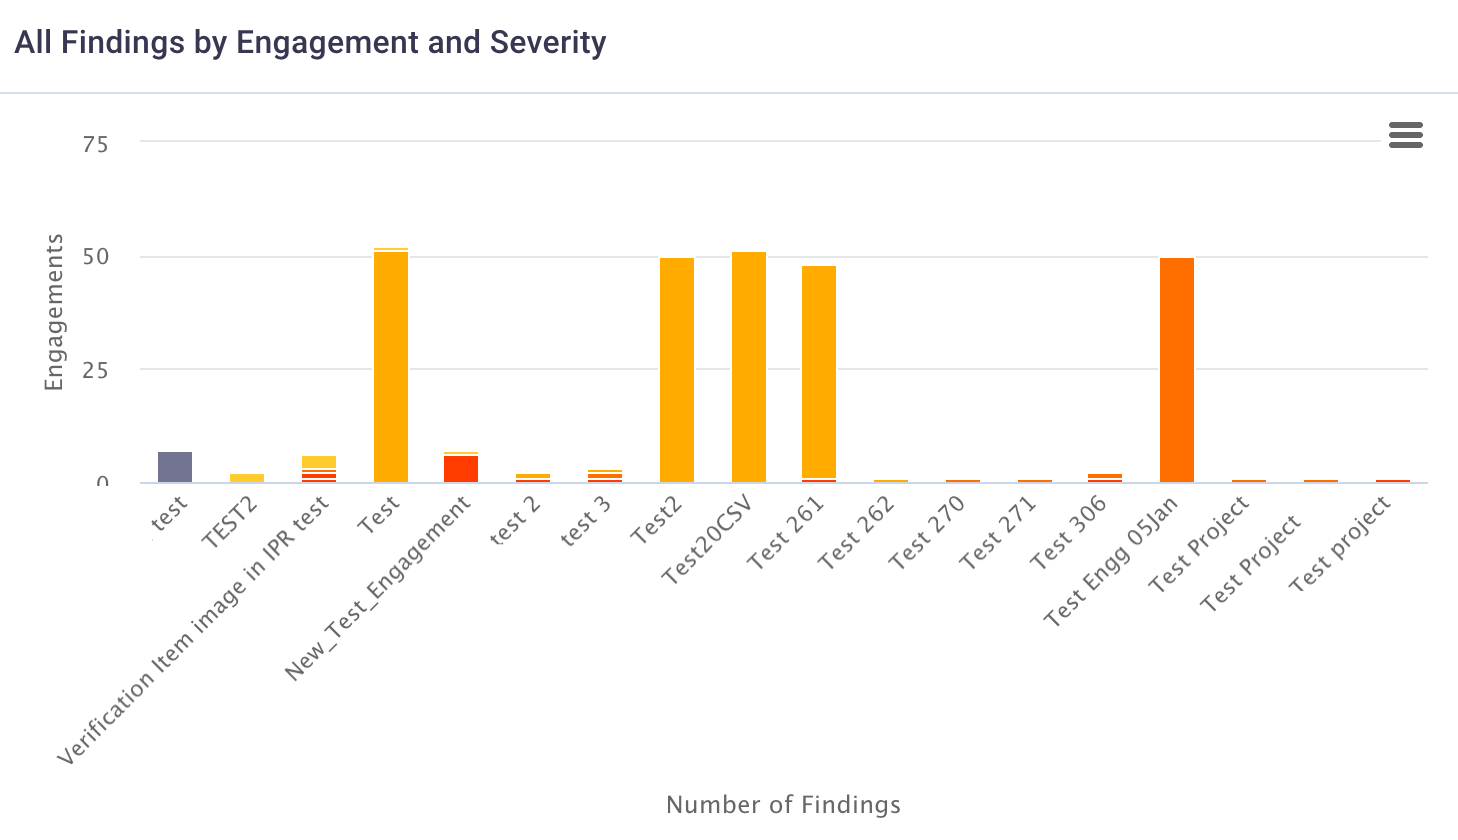
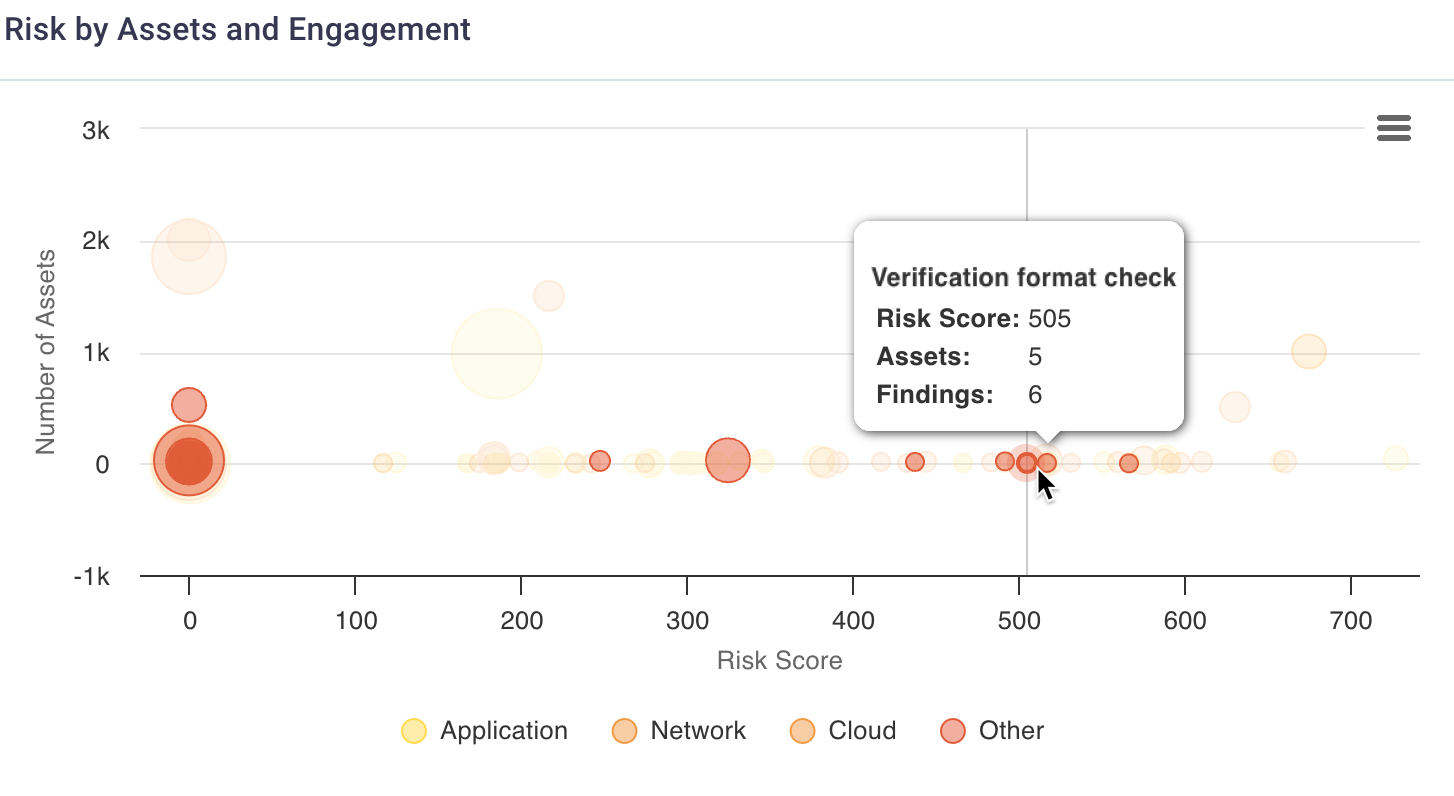
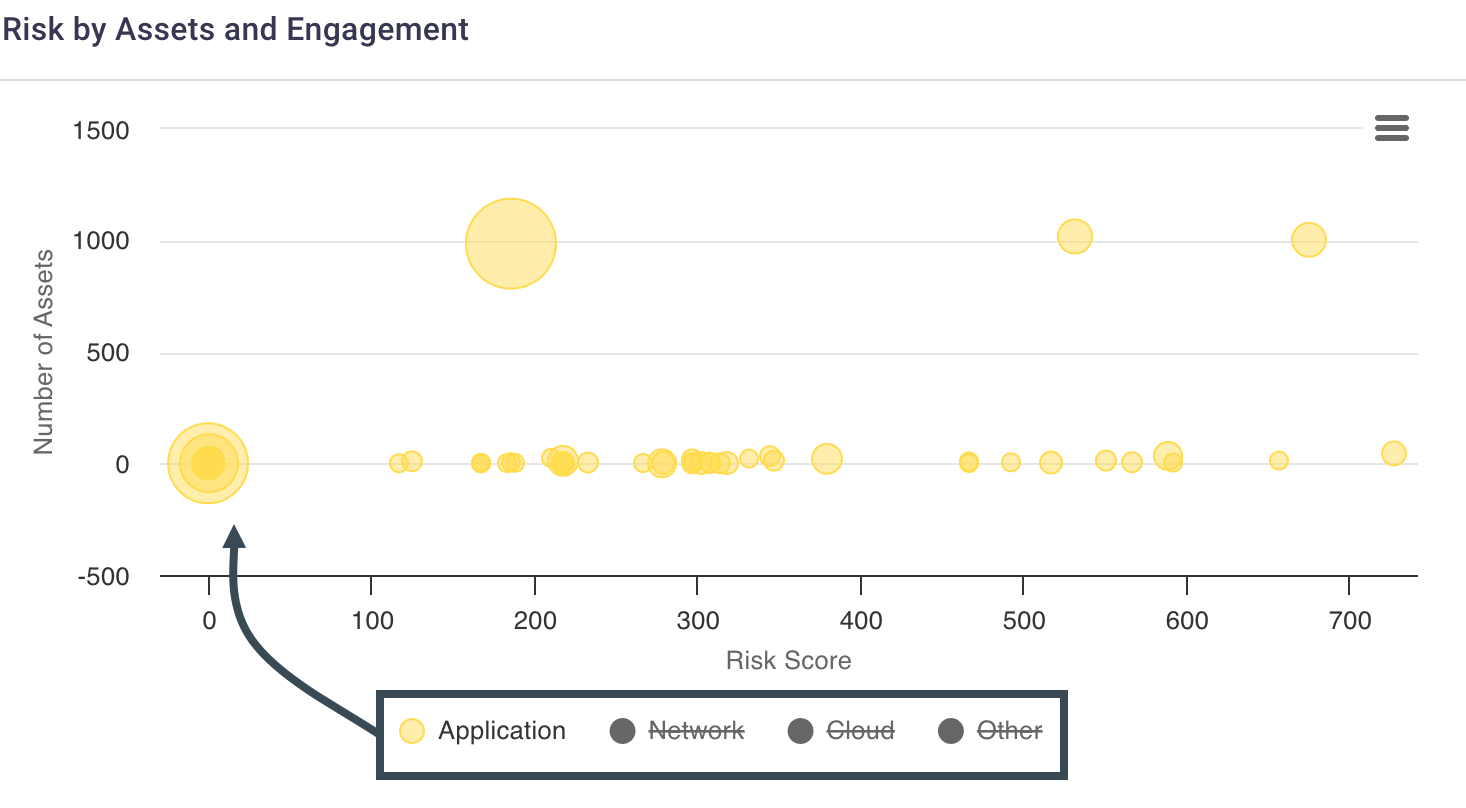
  • Hover over each of the bars to view a count of the number of findings per severity level.
  • Select a specific severity state on a bar to display the Findings page with a table filtered to show that severity state for the findings published in that engagements.


All findings engage severity
Risk by Assets and EngagementThis displays a bubble chart for a quick view of the highest risk scores by engagement including the number of assets and findings that contributed to that risk score.
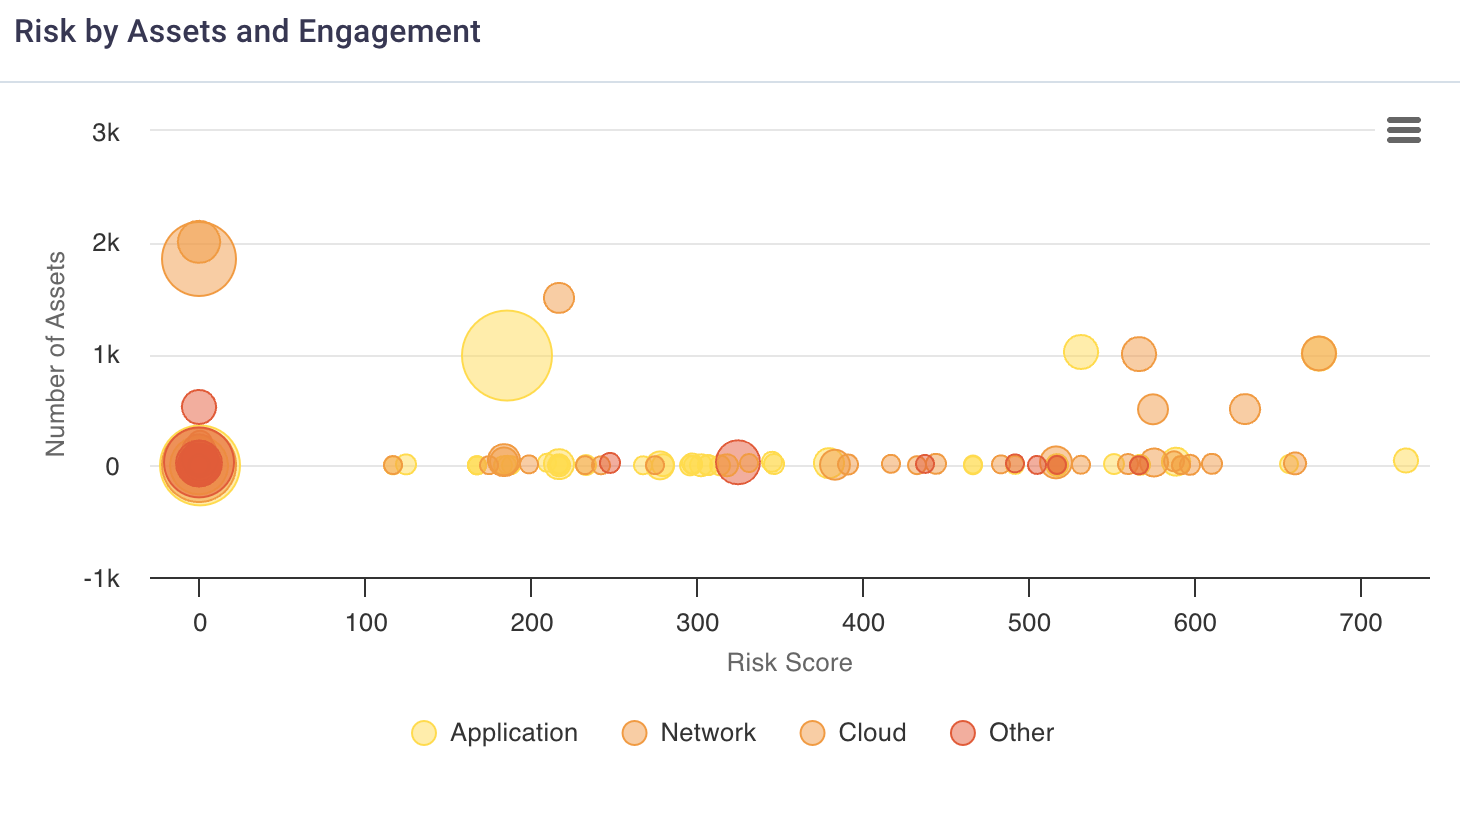
Risk by assess and engage

  • Hover over any engagement bubble in the bubble chart to view risk score and a count of assets and findings for that engagement.

    Risk by assess and engage
  • Select any asset type in the bubble chart's legend (under the X axis) to toggle it off/on for the chart display to exclude/include specific asset types.

    Risk by assess and engage
All Findings by Top 10 OWASP 2021This displays a bar chart of all your organization's engagements; within each engagement column is a color coded number of findings that meet any of the top 10 OWASP categories.
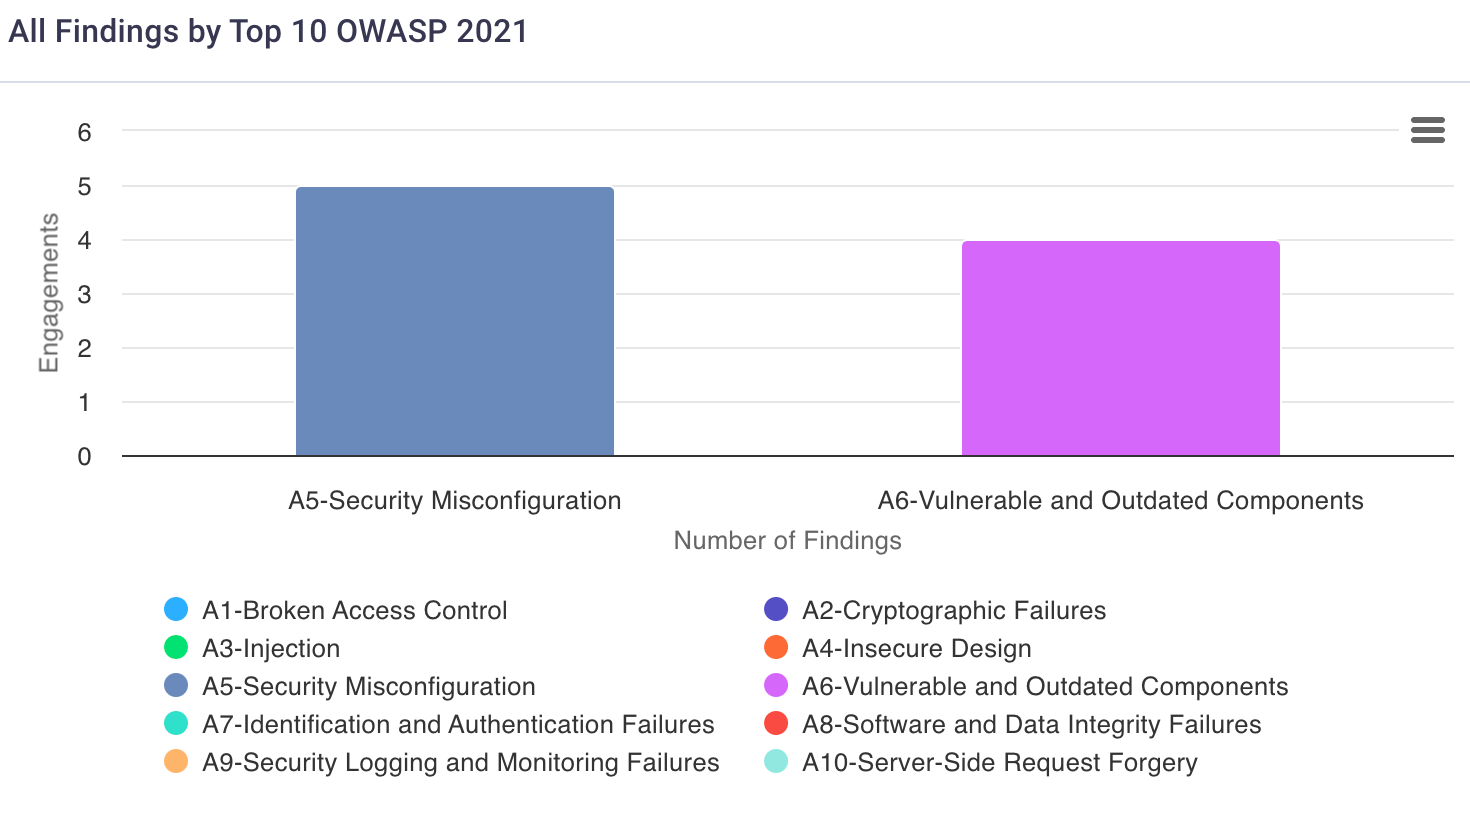
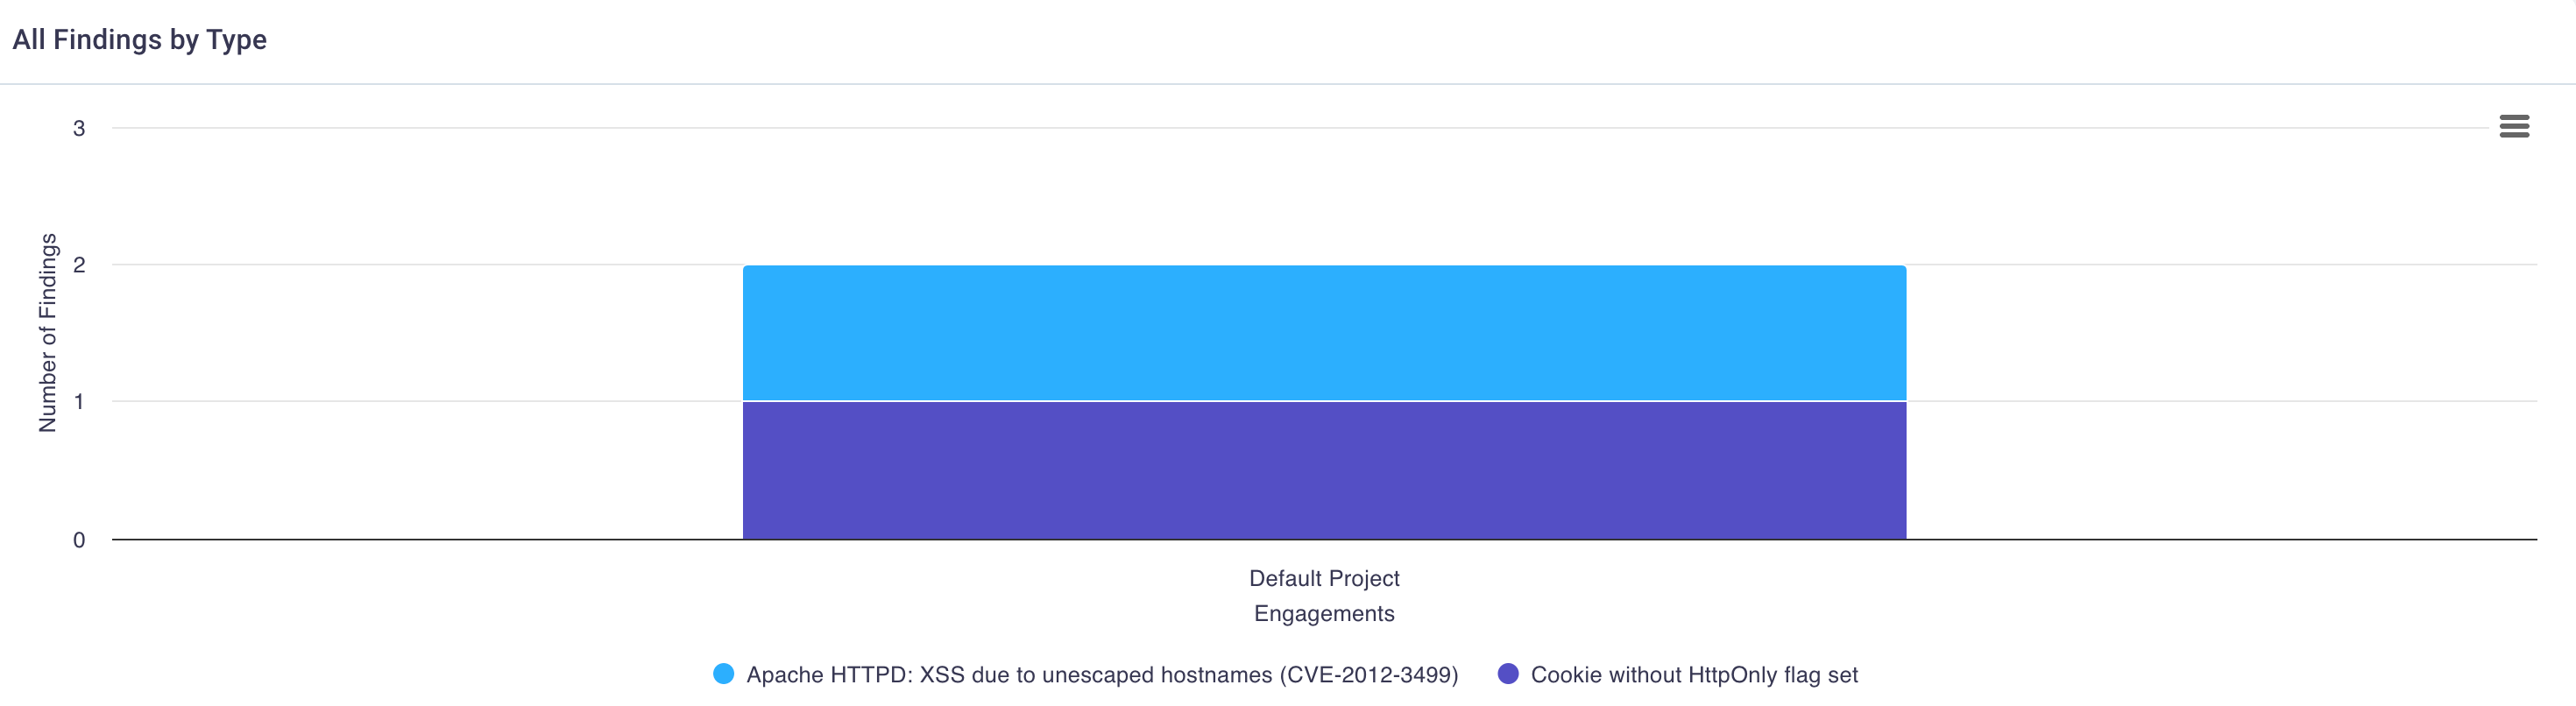
Findings by OWASP
  • Hover over any bar in the chart to see a total finding count of findings that met that top 10 OWASP category.
  • Select any bar's OWASP category to display the Findings page filtered by the selected engagement and OWASP category for those published findings.
All Findings by TypeThis displays a bar chart of all your organization's engagements; within each engagement column is a color coded number of findings by finding type.

  • Hover over any bar in the chart to see a total finding count of findings by a specific finding type.
  • Select any bar's finding type to display the Findings page with all the published findings for that engagement and finding type. All findings by type