#
Navigation menus and icons
The NetSPI Platform’s landing page invites you to launch into the modules and dig into the findings, assets, and data views that help you manage your organization’s security.
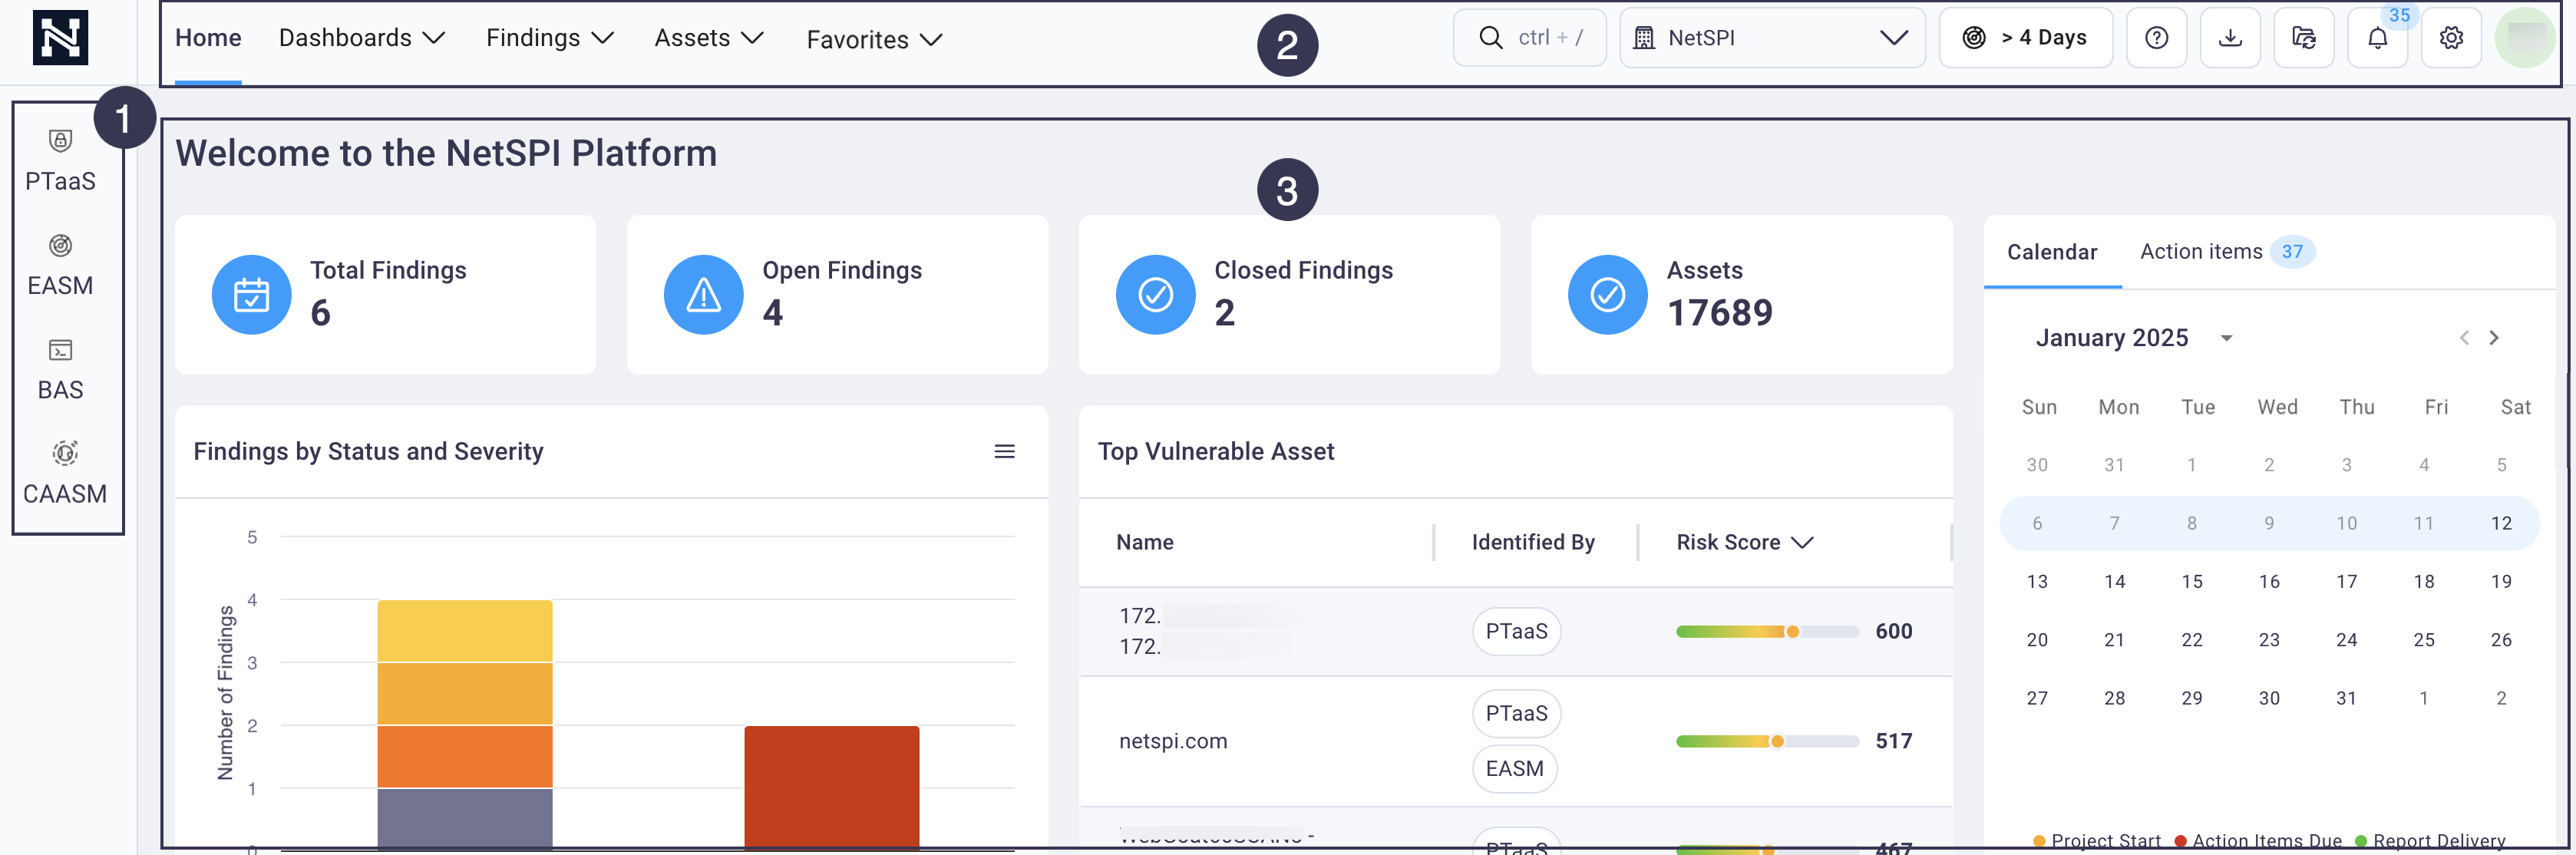
The NetSPI Platform's simple navigation is broken into three sections:
#
1. Left navigation
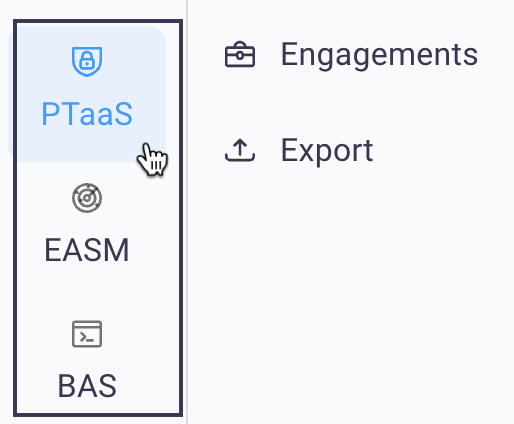
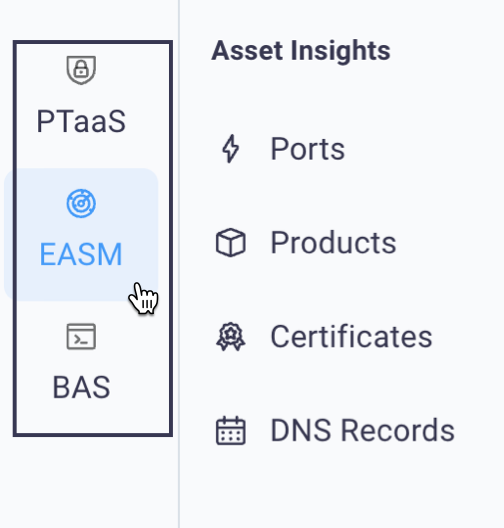
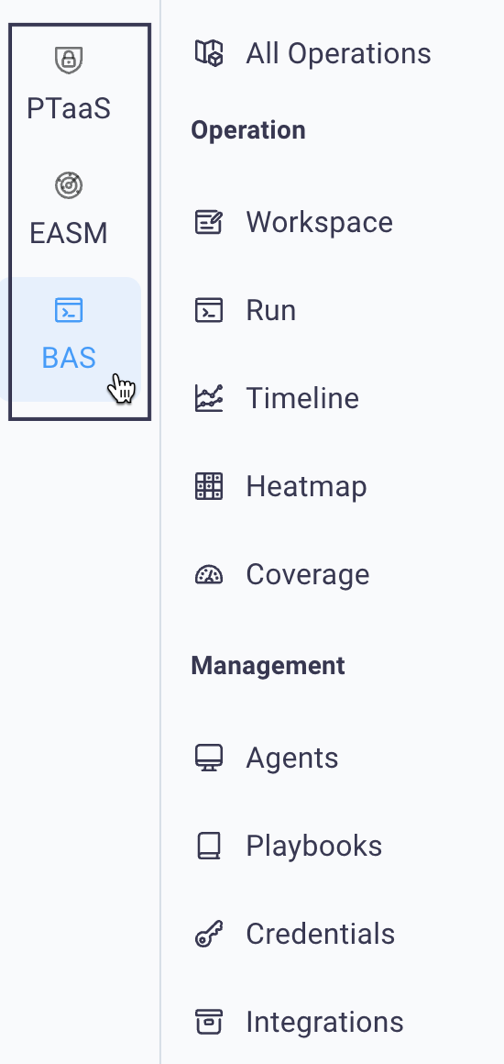
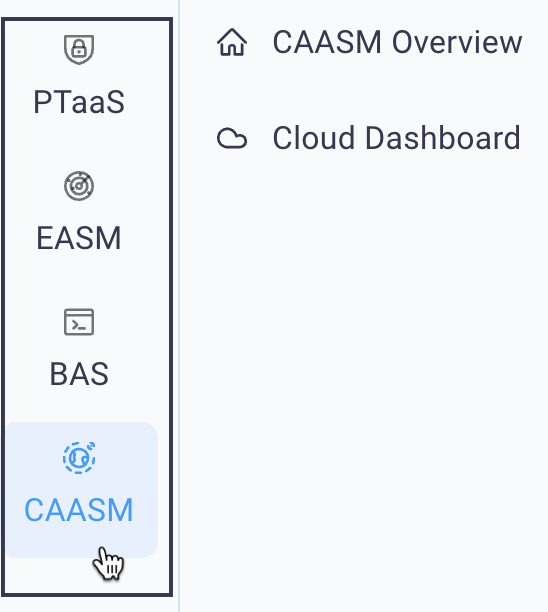
The left navigation pane is where you choose the security module: PTaaS, EASM, BAS, and CAASM.
Hover over a navigation menu item to view and select secondary menu options specific to the product.
For details on all the modules and their functionality, see: PTaaS, EASM, and BAS.
#
2. Top navigation (main NetSPI Platform navigation)
The top menu provides access to all your dashboards:
The top menu is also where you access your organization’s Findings, Assets, Administrative settings, and preferences for the Platform (dark/light mode, notifications settings, etc.).
Select Home (top left menu) from anywhere in the application to return to the NetSPI Platform’s home page.
#
Top-left menu: security data (findings and assets)
The top-left menu navigation is where you'll find the entry point to your findings and assets data.

#
Home
Selecting Home returns you to the NetSPI landing page when selected from anywhere in the Platform. See the NetSPI Platform home page for details.
#
Dashboards
Selecting Dashboards displays the Dashboards drop-down list where you can navigate to dashboards of different focus depending on your task at hand: program management, managing risk, working with all engagements, or reviewing finding trends.
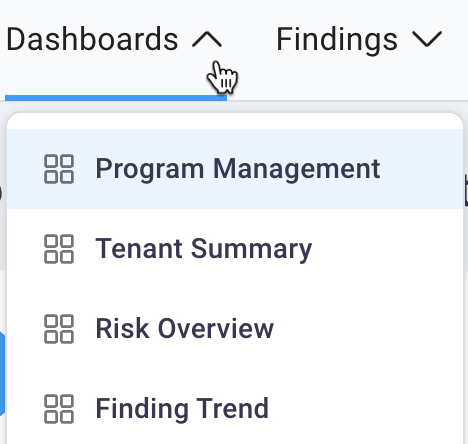
See the Dashboard section for more details.
#
Findings
Selecting Findings displays a drop-down list that allows you to view all of your organization's findings or view findings based on the module where they were identified. Findings identified by more than one module will display in each module's view.
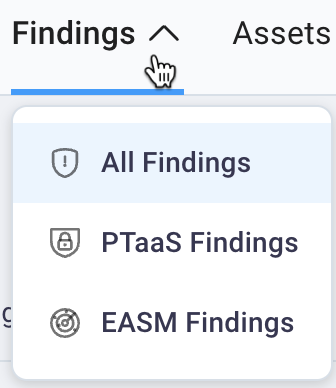
See the Findings Page for more information.
Assets: Selecting Assets displays a drop-down list that allows you to view all of your organization's assets or view assets based on the module where they were identified. Assets identified by more than one module will display in each module's view.
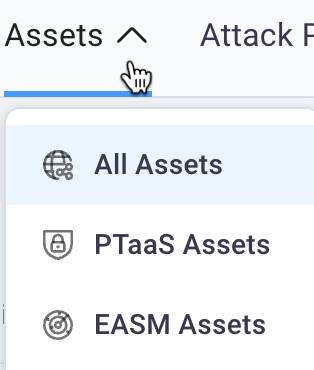
See the Assets Page for more information.
#
Favorites
Selecting Favorites displays a drop-down menu where you can make the current page a favorite by selecting the Favorite Page option, which displays Add to Favorites dialog box.
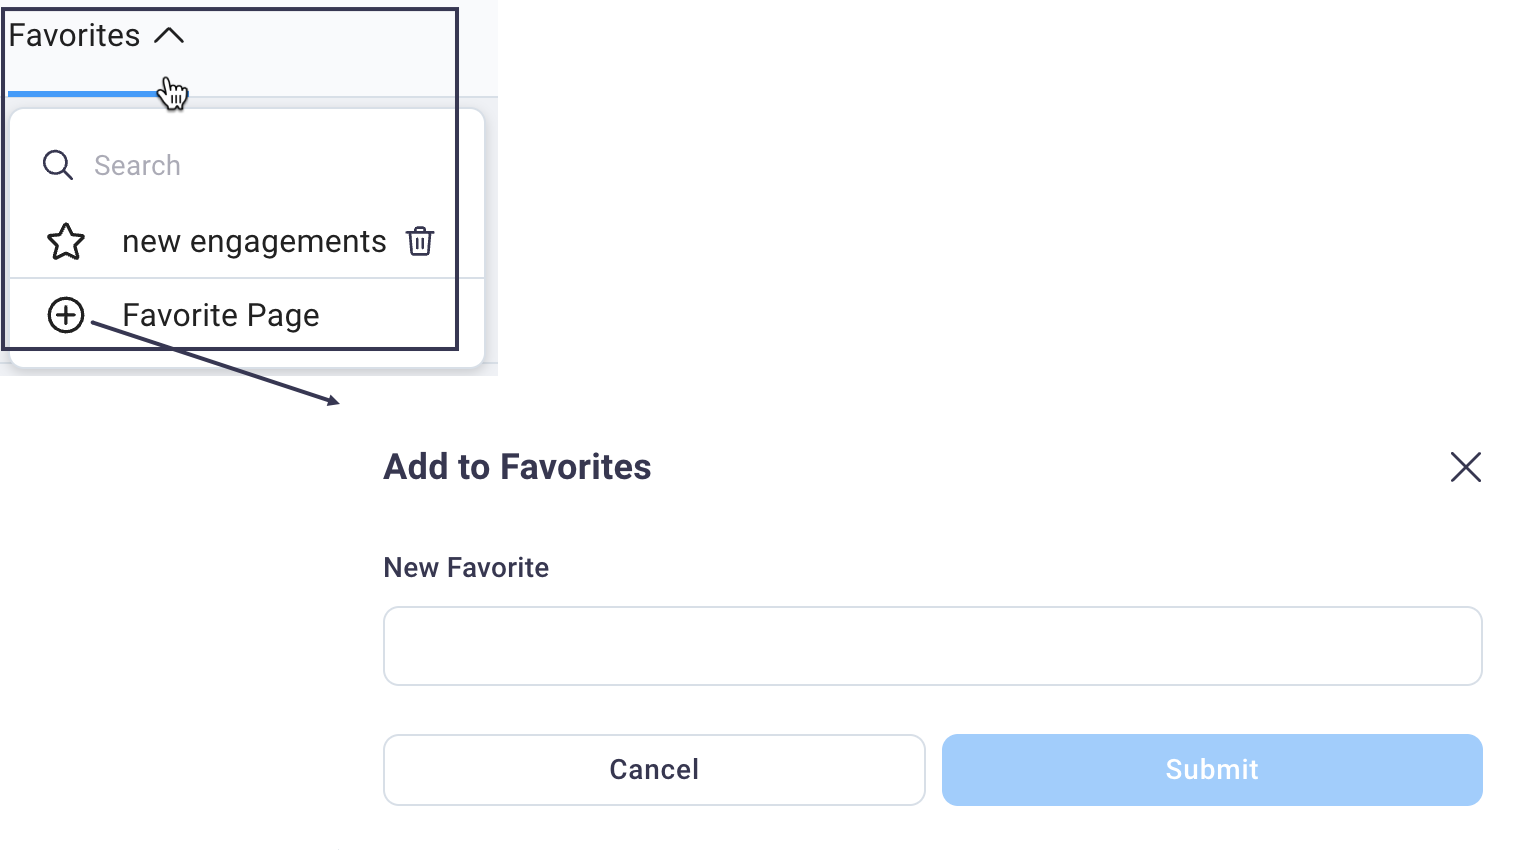
The favorited page will display in the list with a star icon, allowing you to easily return to that page from anywhere in the NetSPI Platform.
You can also delete favorites from the Favorites drop-down list by selecting the garbage can icon.
#
Top-right menu: Platform Configuration and Notifications
Use the top menu’s top-right navigation to manage your organization, application help, view export notifications, view all notifications, set dark/light theme, set system settings, set your personal profile and notification settings or log out.

The sections below provide details about the top-right navigation functions.
#
Global search
The global search button ![]() can be opened two ways: select
the Global Search button or type the keyboard shortcut that displays within the button text (e.g.,
can be opened two ways: select
the Global Search button or type the keyboard shortcut that displays within the button text (e.g., ctrl + /).
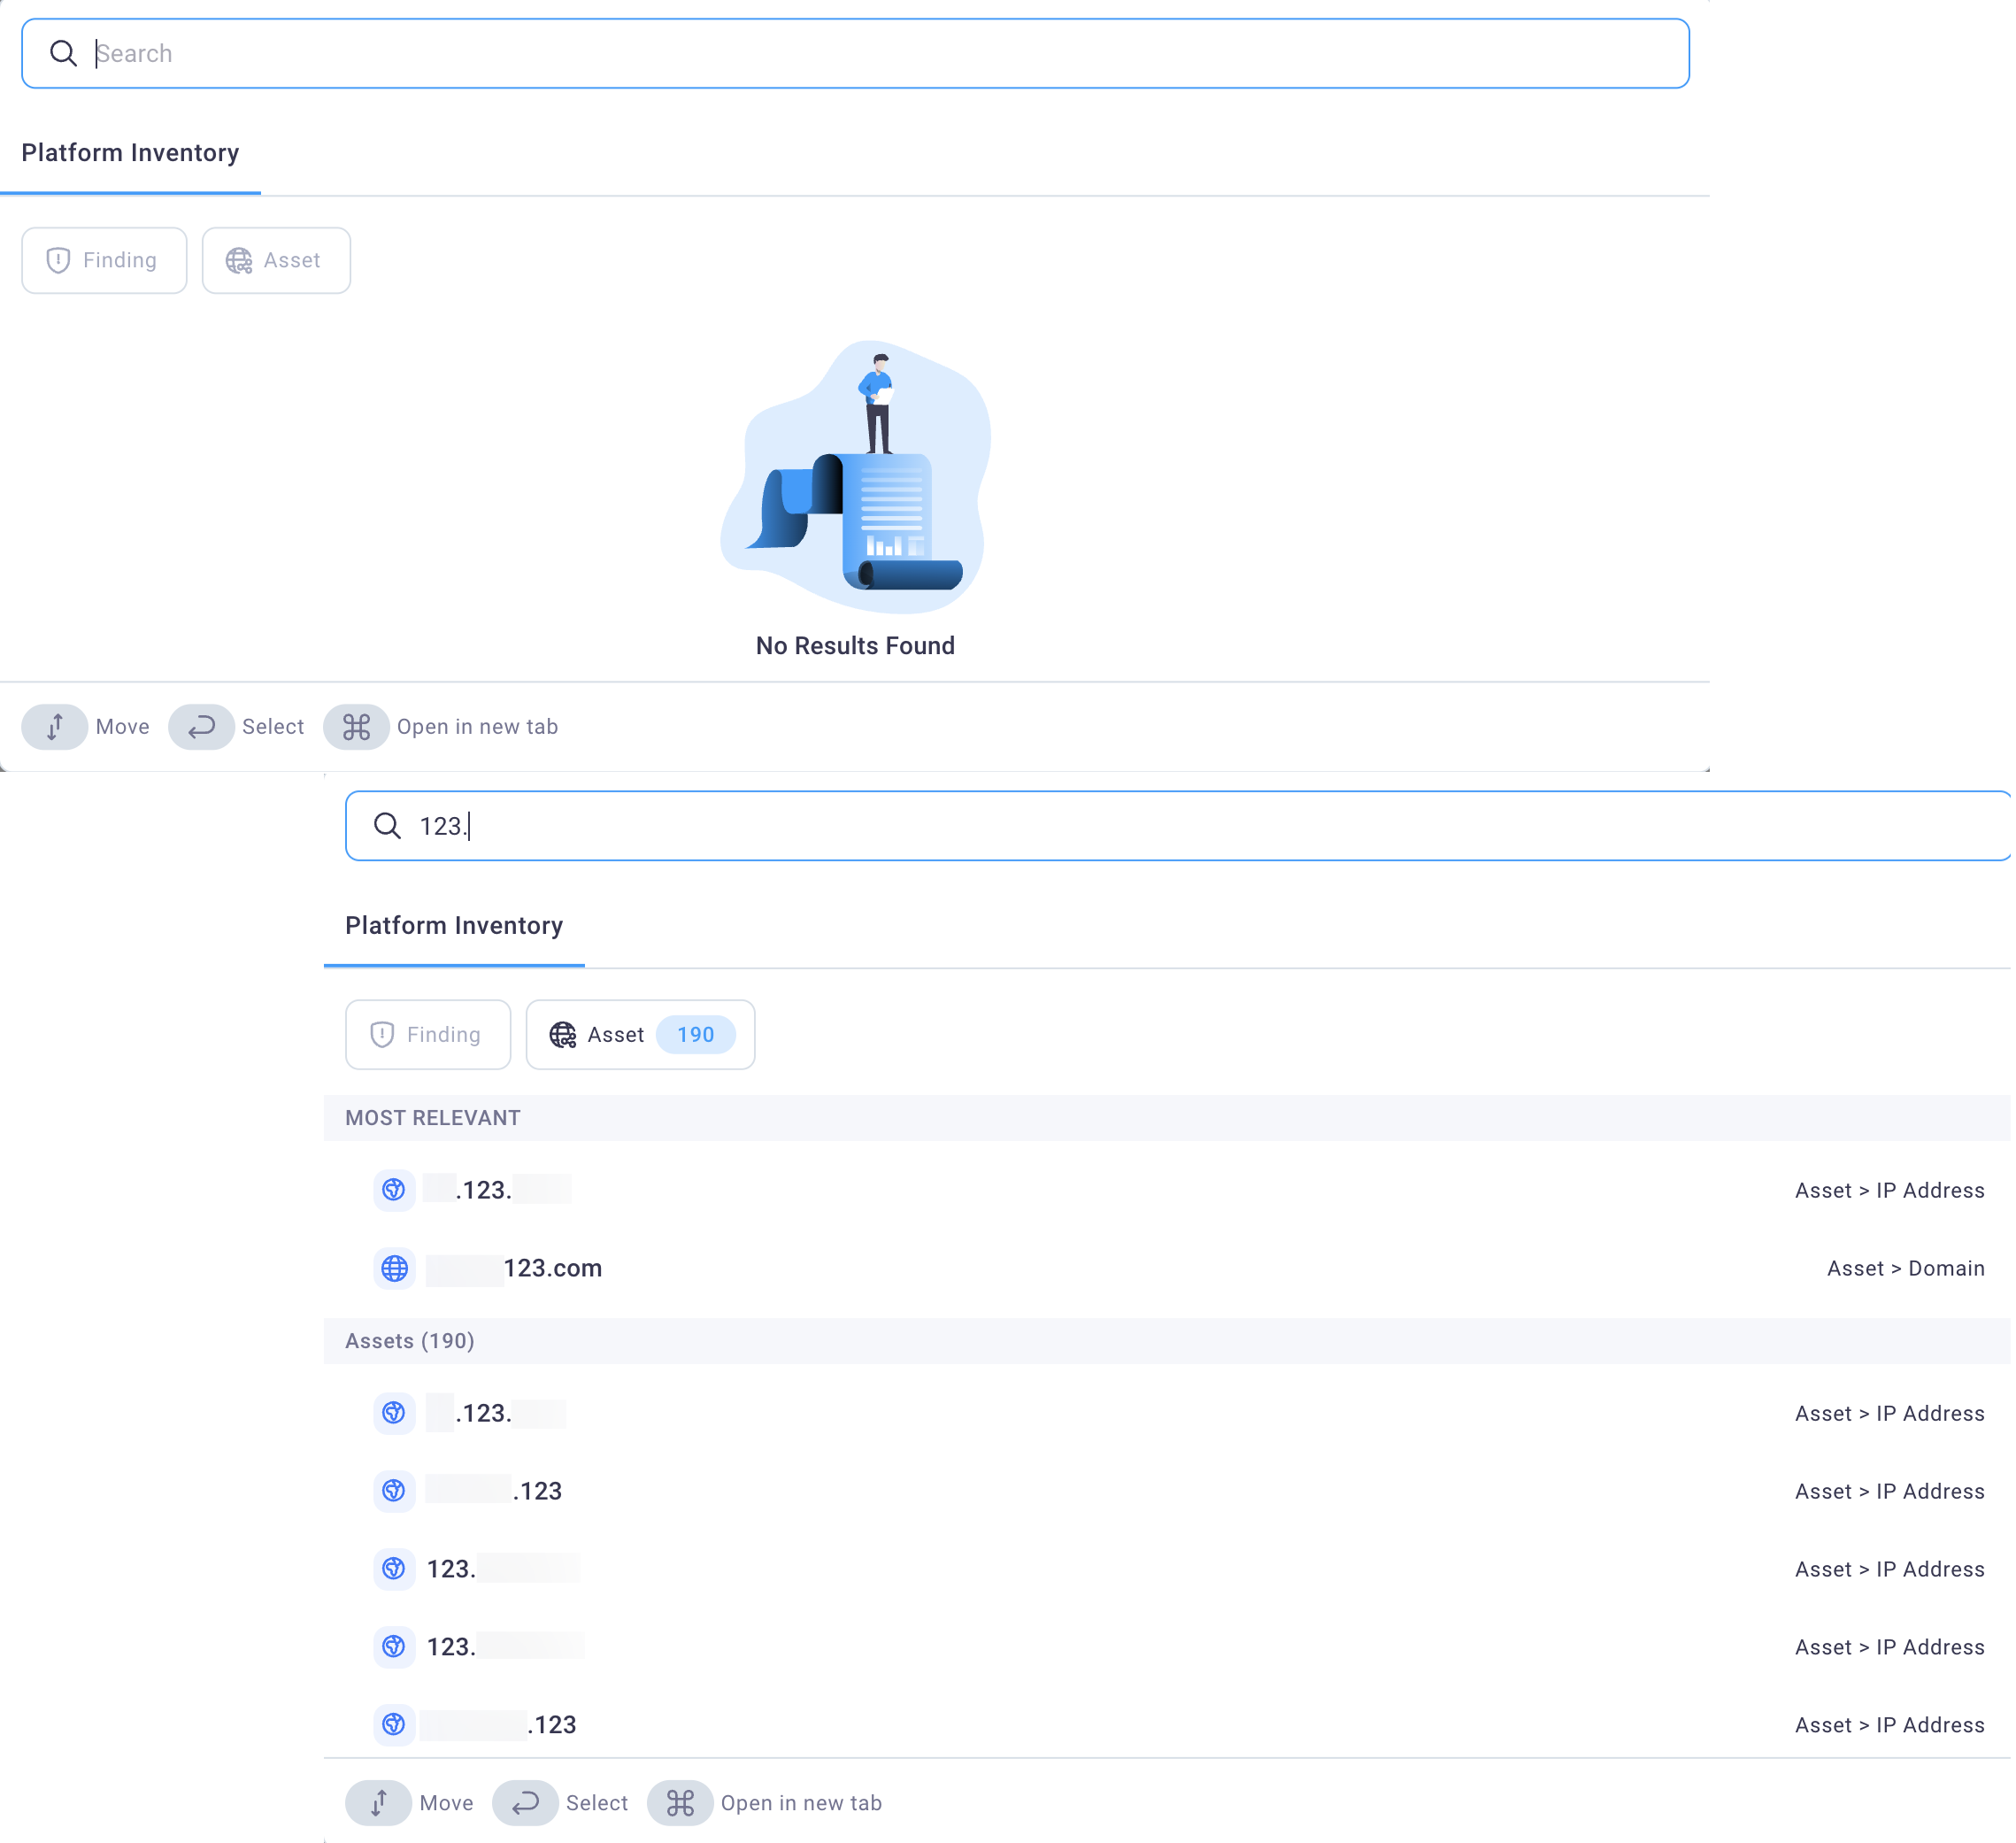
Searches actively begin once you start typing to match the characters entered and display the location/category to the right of each returned.
#
Organization selector
If you have more than one organization on the NetSPI Platform (subsidiaries, etc.), you can view data for each organization's data by selecting it from the Organization drop-down list.
![]()
The Organization selector also supports freeform text entry so you can search for a specific organization by typing its name in the drop-down list field.
#
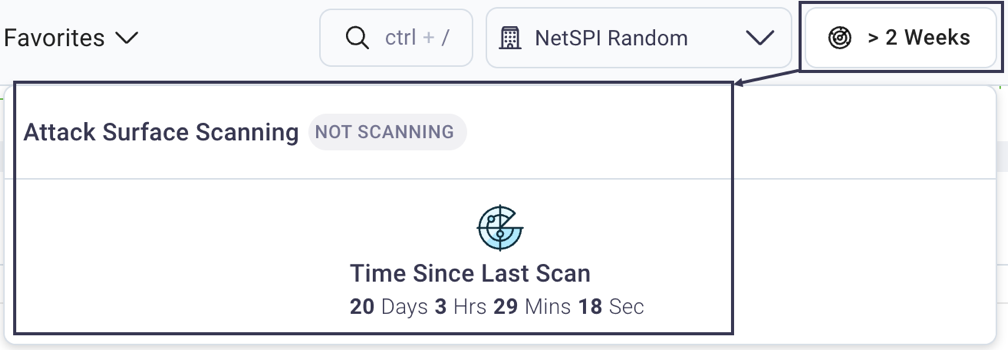
Attack Surface Scanning
The Attack Surface Scanning icon is a quick status indicator of your scanning status for the EASM module. Selecting the icon displays the time since your last attack surface scan, and it shows if the workflows (scans) are currently running so you have an idea of what is happening behind the scenes. See the EASM section for more information on the External Attack Surface Management module.
#
Help/documentation
Selecting the Help  opens the NetSPI Platform documentation in a new browser
tab.
opens the NetSPI Platform documentation in a new browser
tab.
#
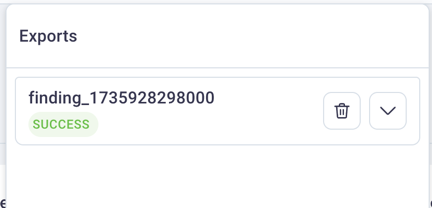
Export history
Selecting the Exports ![]() icon opens an Exports dialog box that displays all export
notifications.
icon opens an Exports dialog box that displays all export
notifications.
#
Async Jobs status
Selecting the Async Jobs  icon displays the asynchronous jobs queue.
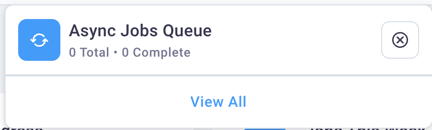
Selecting the View All link displays a table of all of your organization's asynchronous jobs and their status.
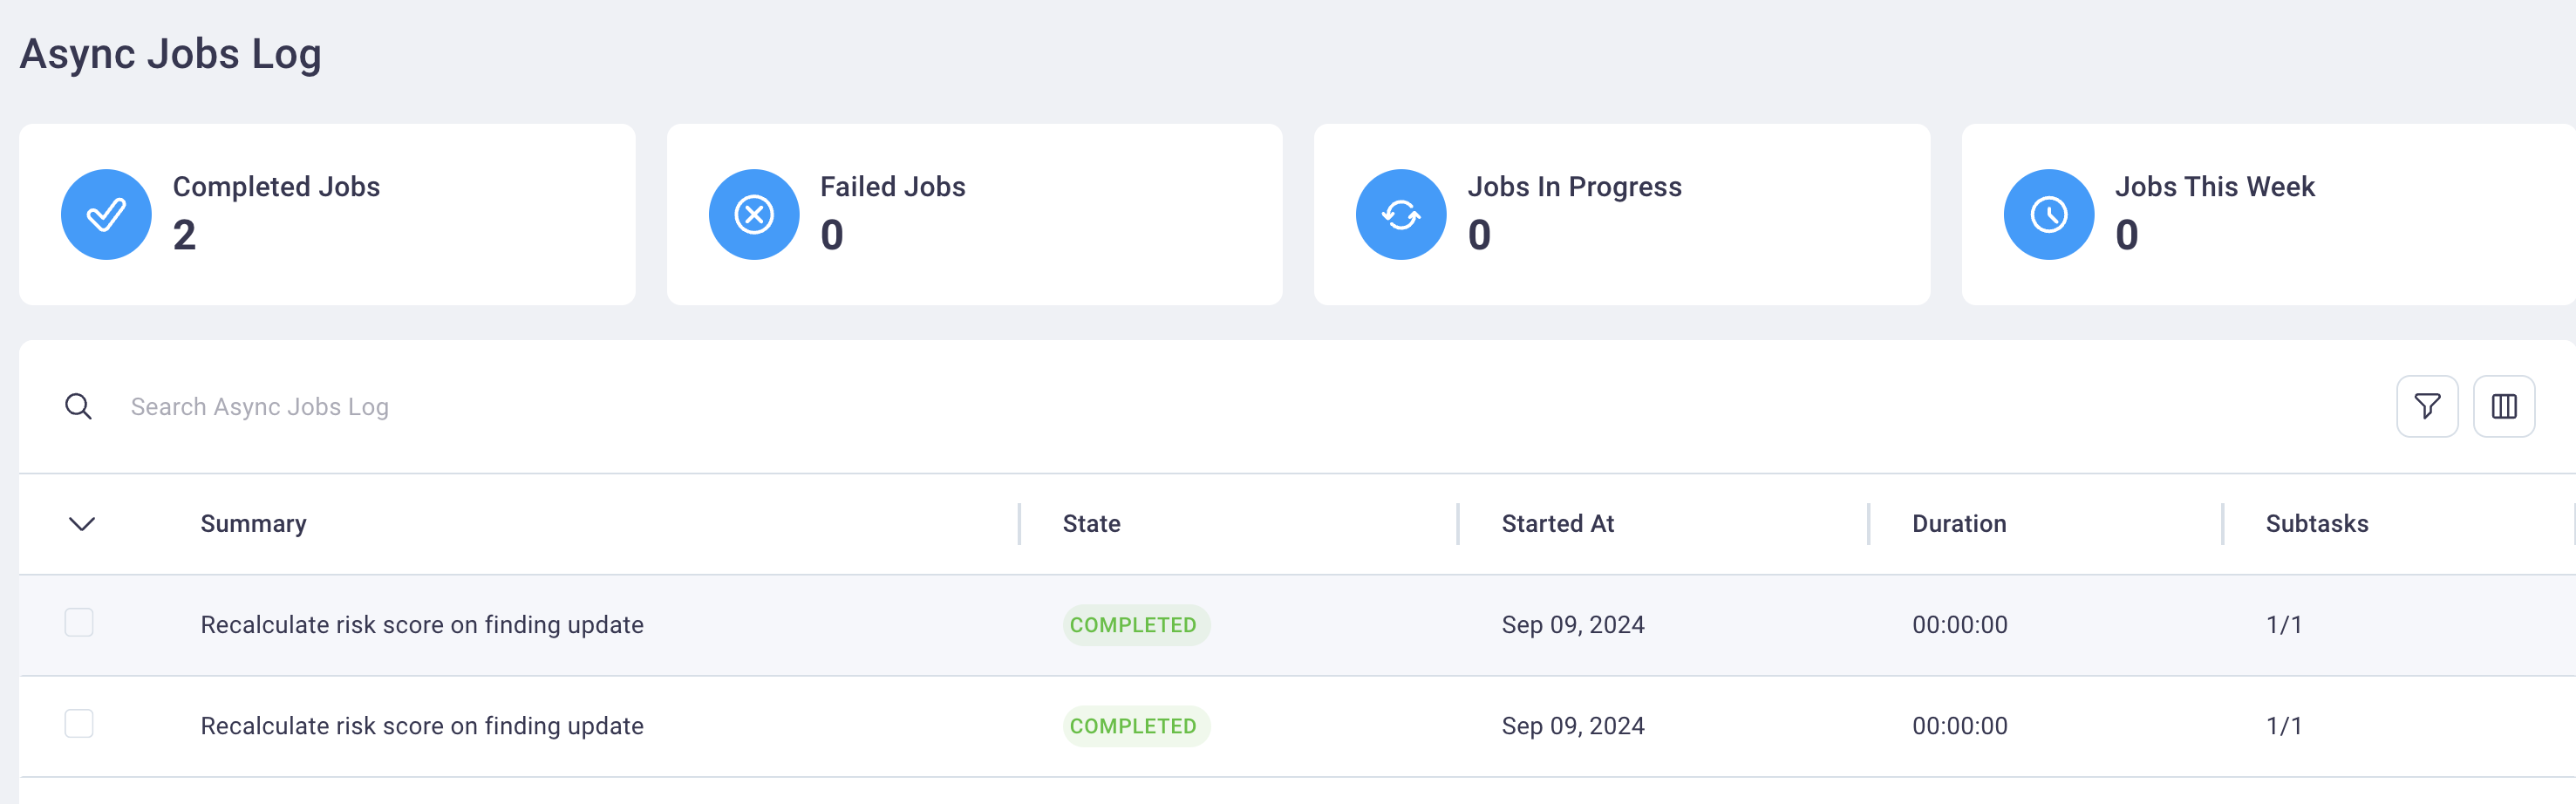
See the Viewing asynchronous jobs section for more details.
#
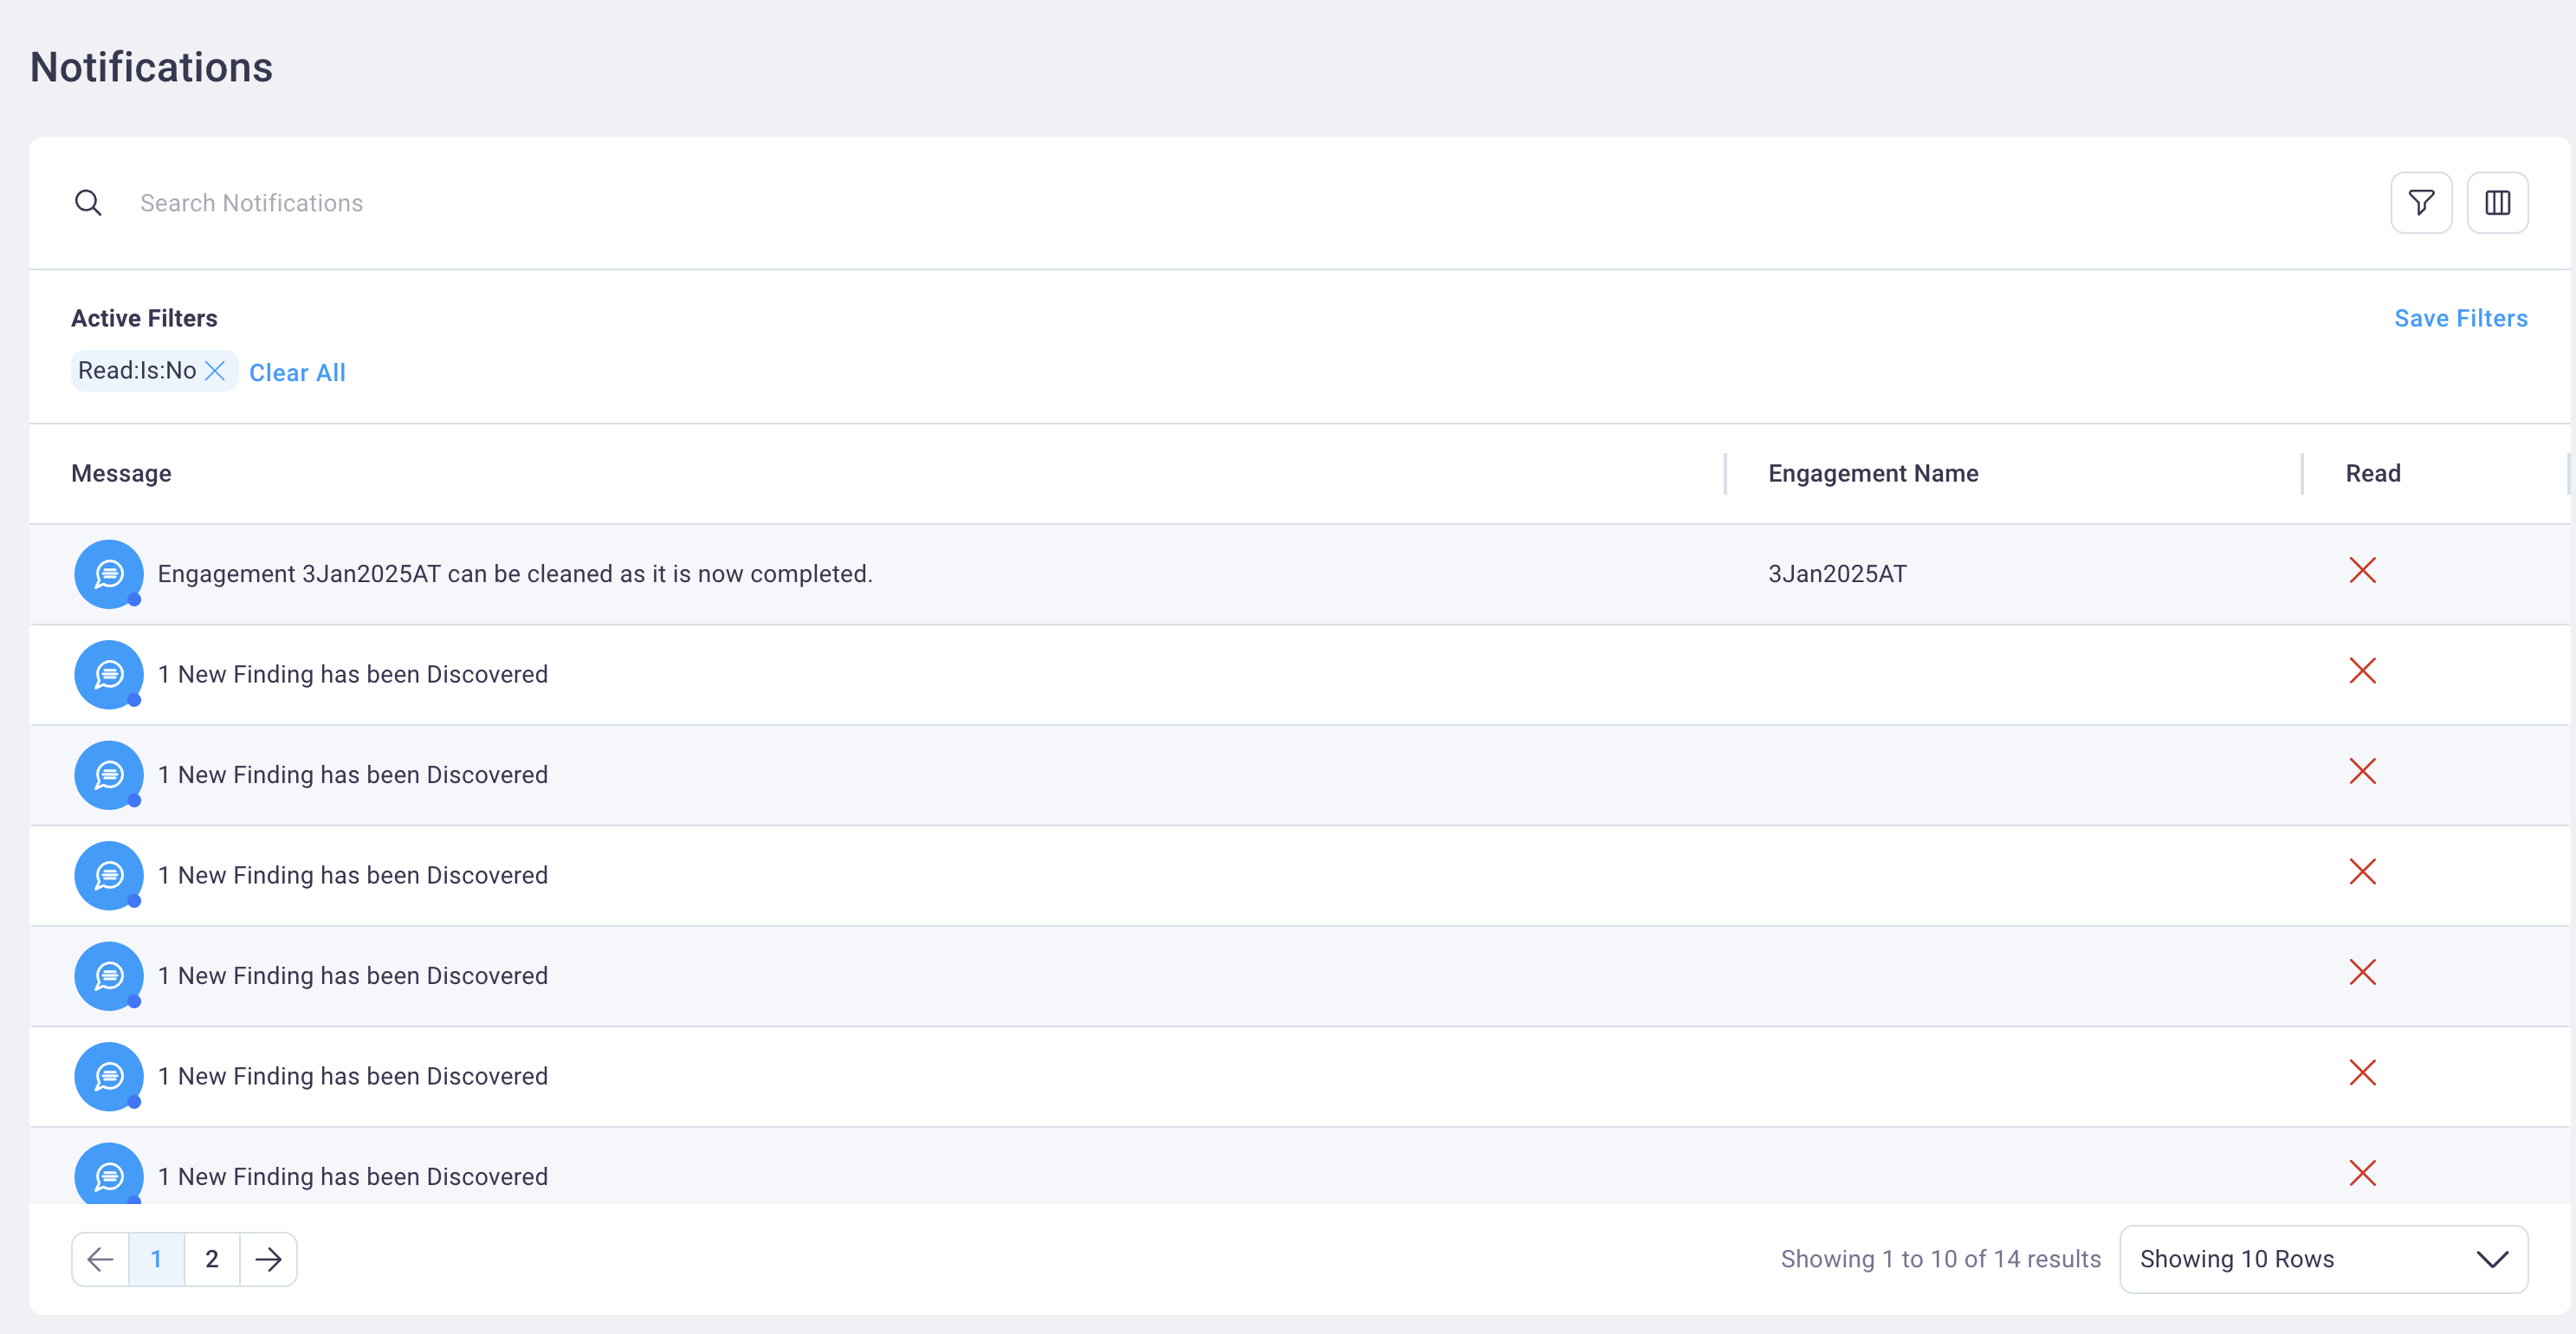
Notifications
Selecting the Notifications  icon opens a Notifications dialog
box to view general notifications. A total count of unread notifications displays along with a link to mark all of the
notifications as read. Selecting an individual notification brings the subject of that notification into focus.
icon opens a Notifications dialog
box to view general notifications. A total count of unread notifications displays along with a link to mark all of the
notifications as read. Selecting an individual notification brings the subject of that notification into focus.
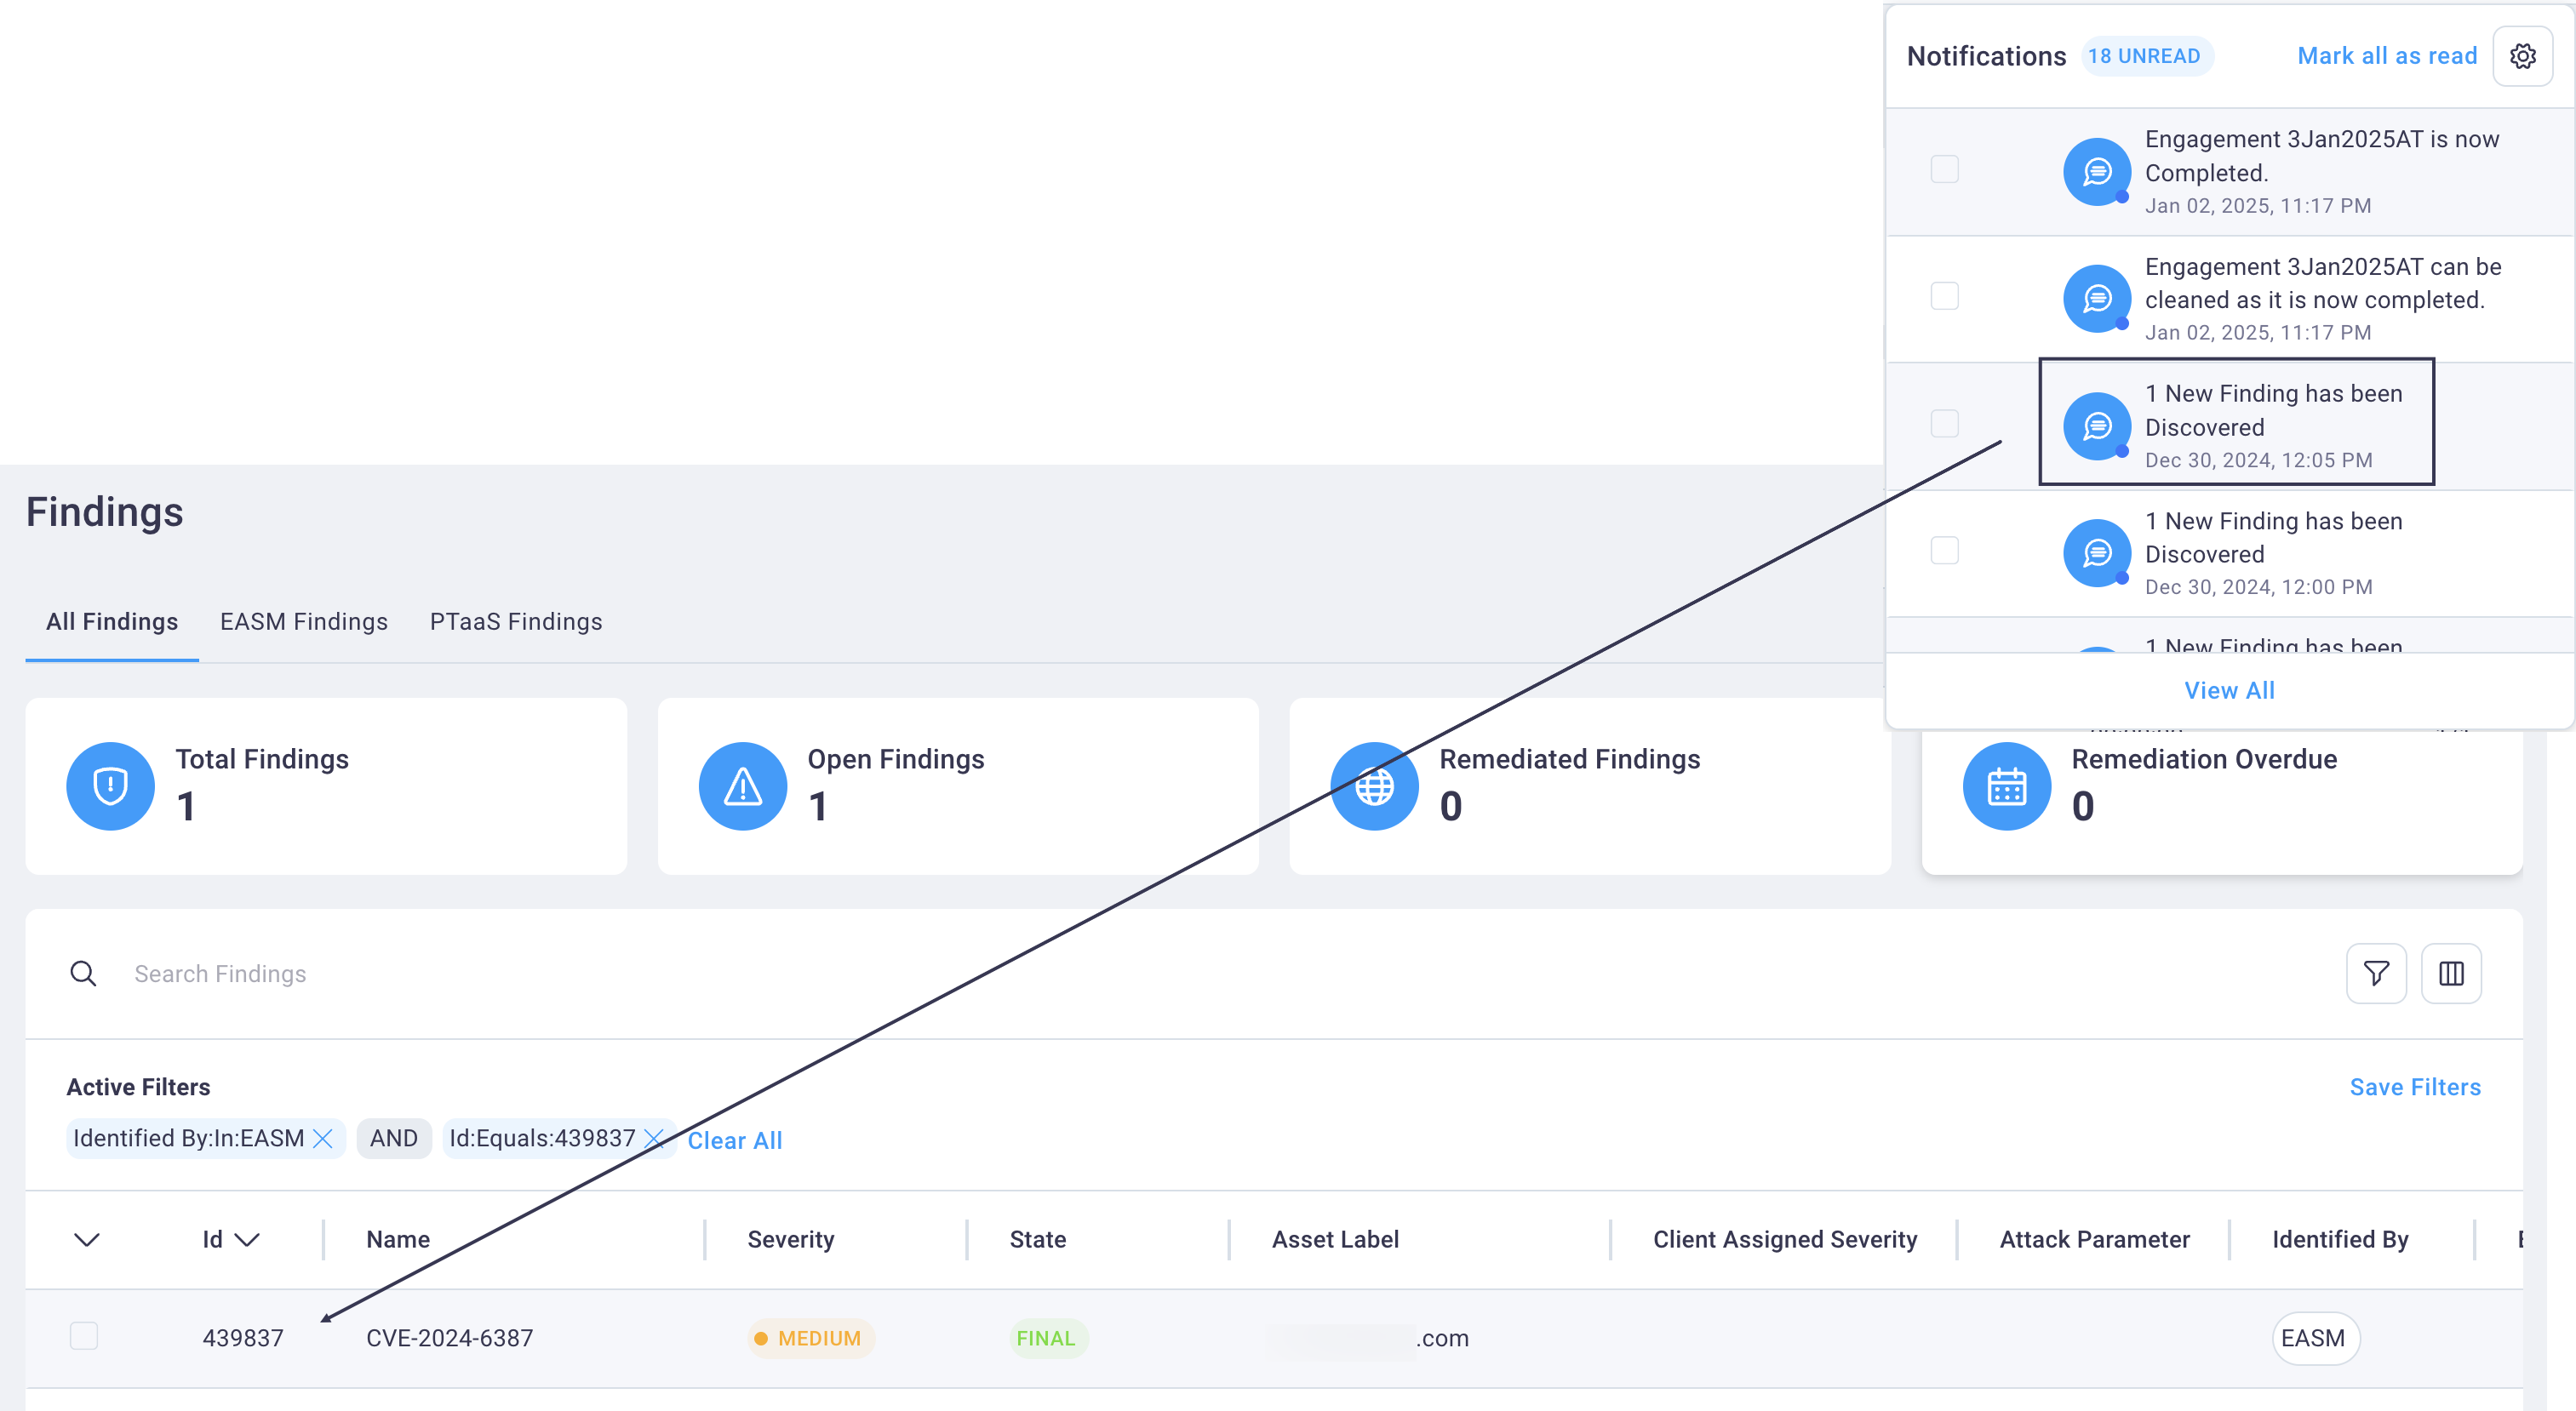
For example, selecting a "1 New Finding has been discovered" notification takes you to the findings table, which is auto-filtered to display that new finding.
Selecting the View All link displays a table of all unread notifications where you can review them in a larger format.
#
Settings (for administrators)
Select the Settings  icon to access administrative configurations to:
- Set granular admin-level notifications
- Manage your organization's users
- Configure your third-party integrations with the NetSPI Platform
- Manage module-specific settings for PTaaS, EASM, BAS, and CAASM
- Search, filter, and add Tags that can be applied to your findings and other data
- Manage policies for custom alerts from the NetSPI Platform
See the Settings section for details.
#
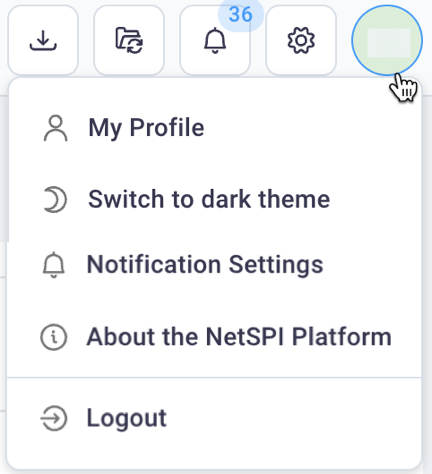
User profile, module permissions, and API token
Select you User profile avatar to manage the following items.
My Profile: Update your personal contact information (name, email, phone), update your avatar image, and geographic location details and last time logged in. You can also view your access level for each of the NetSPI Platform modules on the PTaaS, EASM, and BAS tabs, as well as your API token and a link to the API documentation from the API tab.
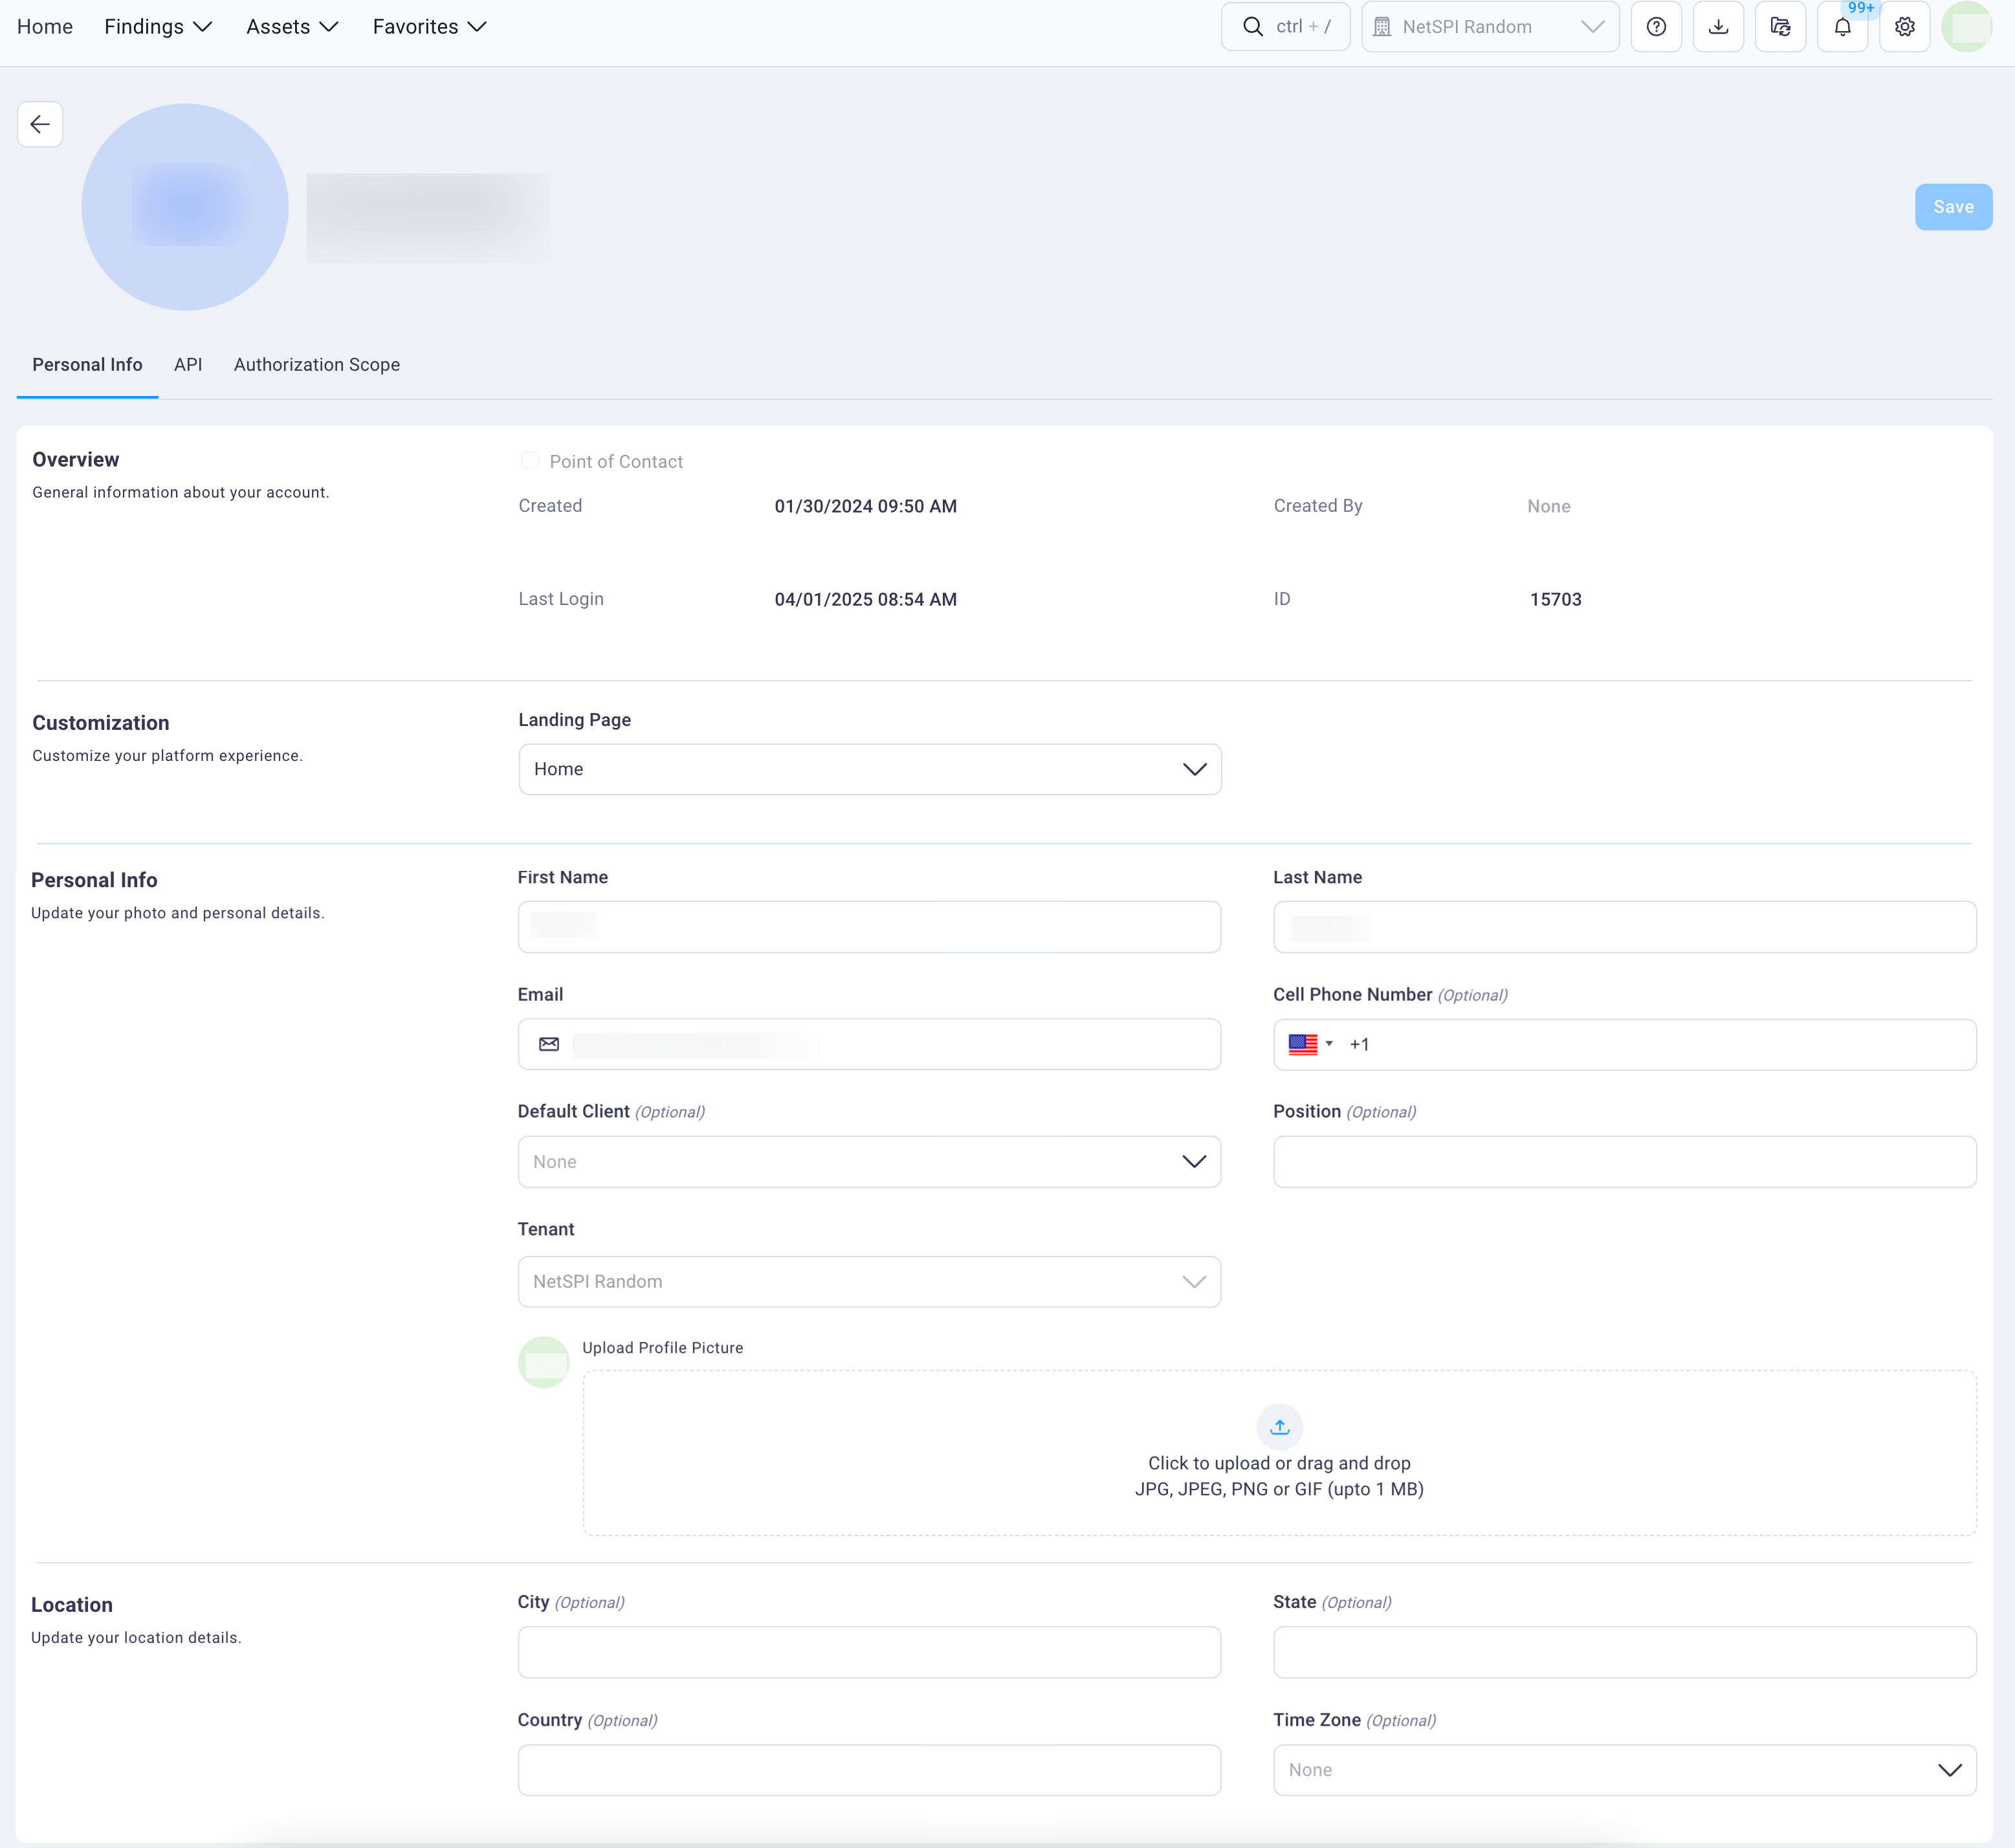
You can also:
Customize your default landing page by selecting a value from the Landing Page drop-down list in the Customization field group
Restore default column display for all NetSPI Platform tables at once by selecting the Restore Default Columns button in the Customization field group
Options are scoped to the NetSPI Platform module(s) you subscribe to. The full list of options, including all modules is provided below.
- Assets
- All Assets
- CAASM Assets
- EASM Assets
- PTaaS Assets
- BAS
- All Projects
- Coverage
- Heatmap
- Run
- Timeline
- Workspace
- Dashboards
- Attack Surface
- Executive Summary
- Finding Trend
- Home
- Program Management
- Retest Log
- Risk Overview
- Findings
- All Findings
- CAASM Findings
- EASM findings
- PTaaS findings
- EASM
- Certificates
- DNS Records
- Ports
- Products
- Tasks
- Workflow
- Engagements
- Engagements
- Global Engagements
A NetSPI Platform user with admin privileges from your organization can:
Create API tokens for non-admin users from your organization. See the Create an API token for your users section for details.
Add and/or update your module permissions for non-admin users from your organization. See the Add module permissions for your users section for more information.
Switch to dark/light theme: Select the dark/light option to immediately toggle your display to dark or light theme.
Notification Settings: Select the Set Notification Settings option in the drop-down list to set your preferences for notifications sent to you from the NetSPI Platform; visit the Notification management section for details.
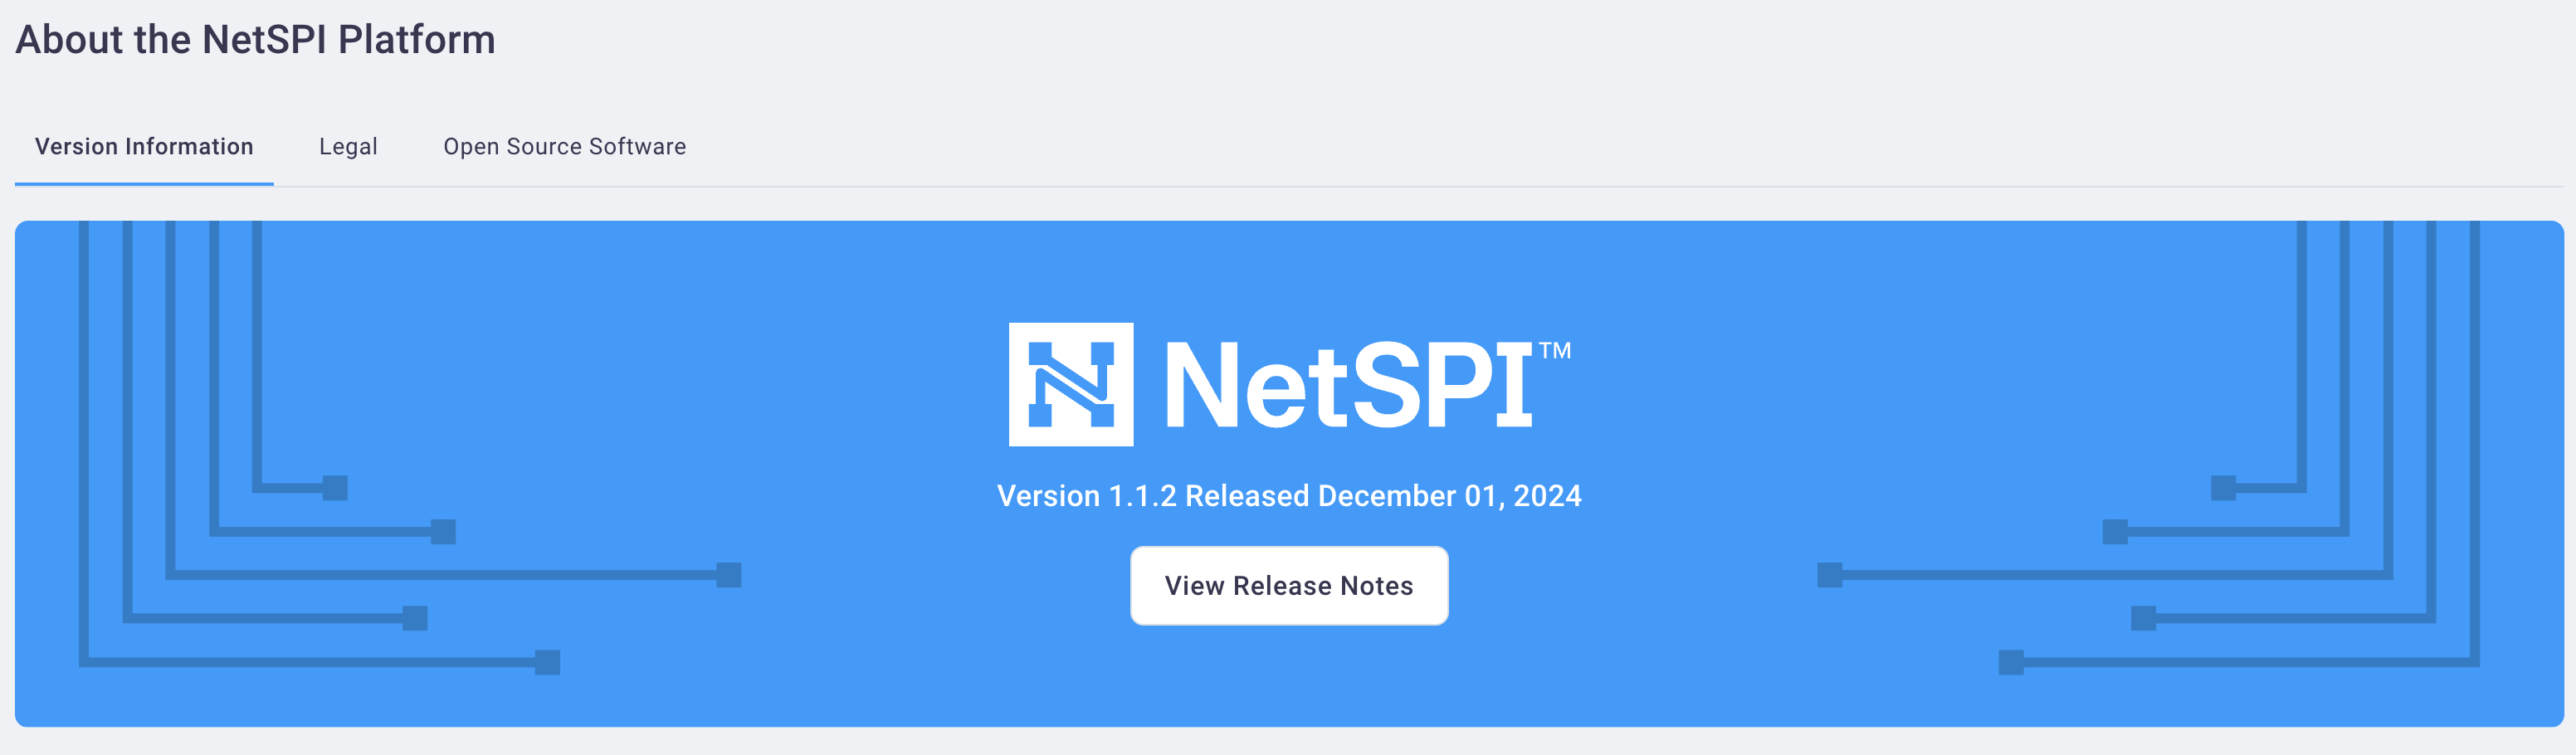
About the NetSPI Platform: View the latest NetSPI Platform version number and link to release notes, NetSPI's legal disclaimer, and a list of open source software used in the creation of the NetSPI Platform. x
Selecting Logout logs you out of the application.
#
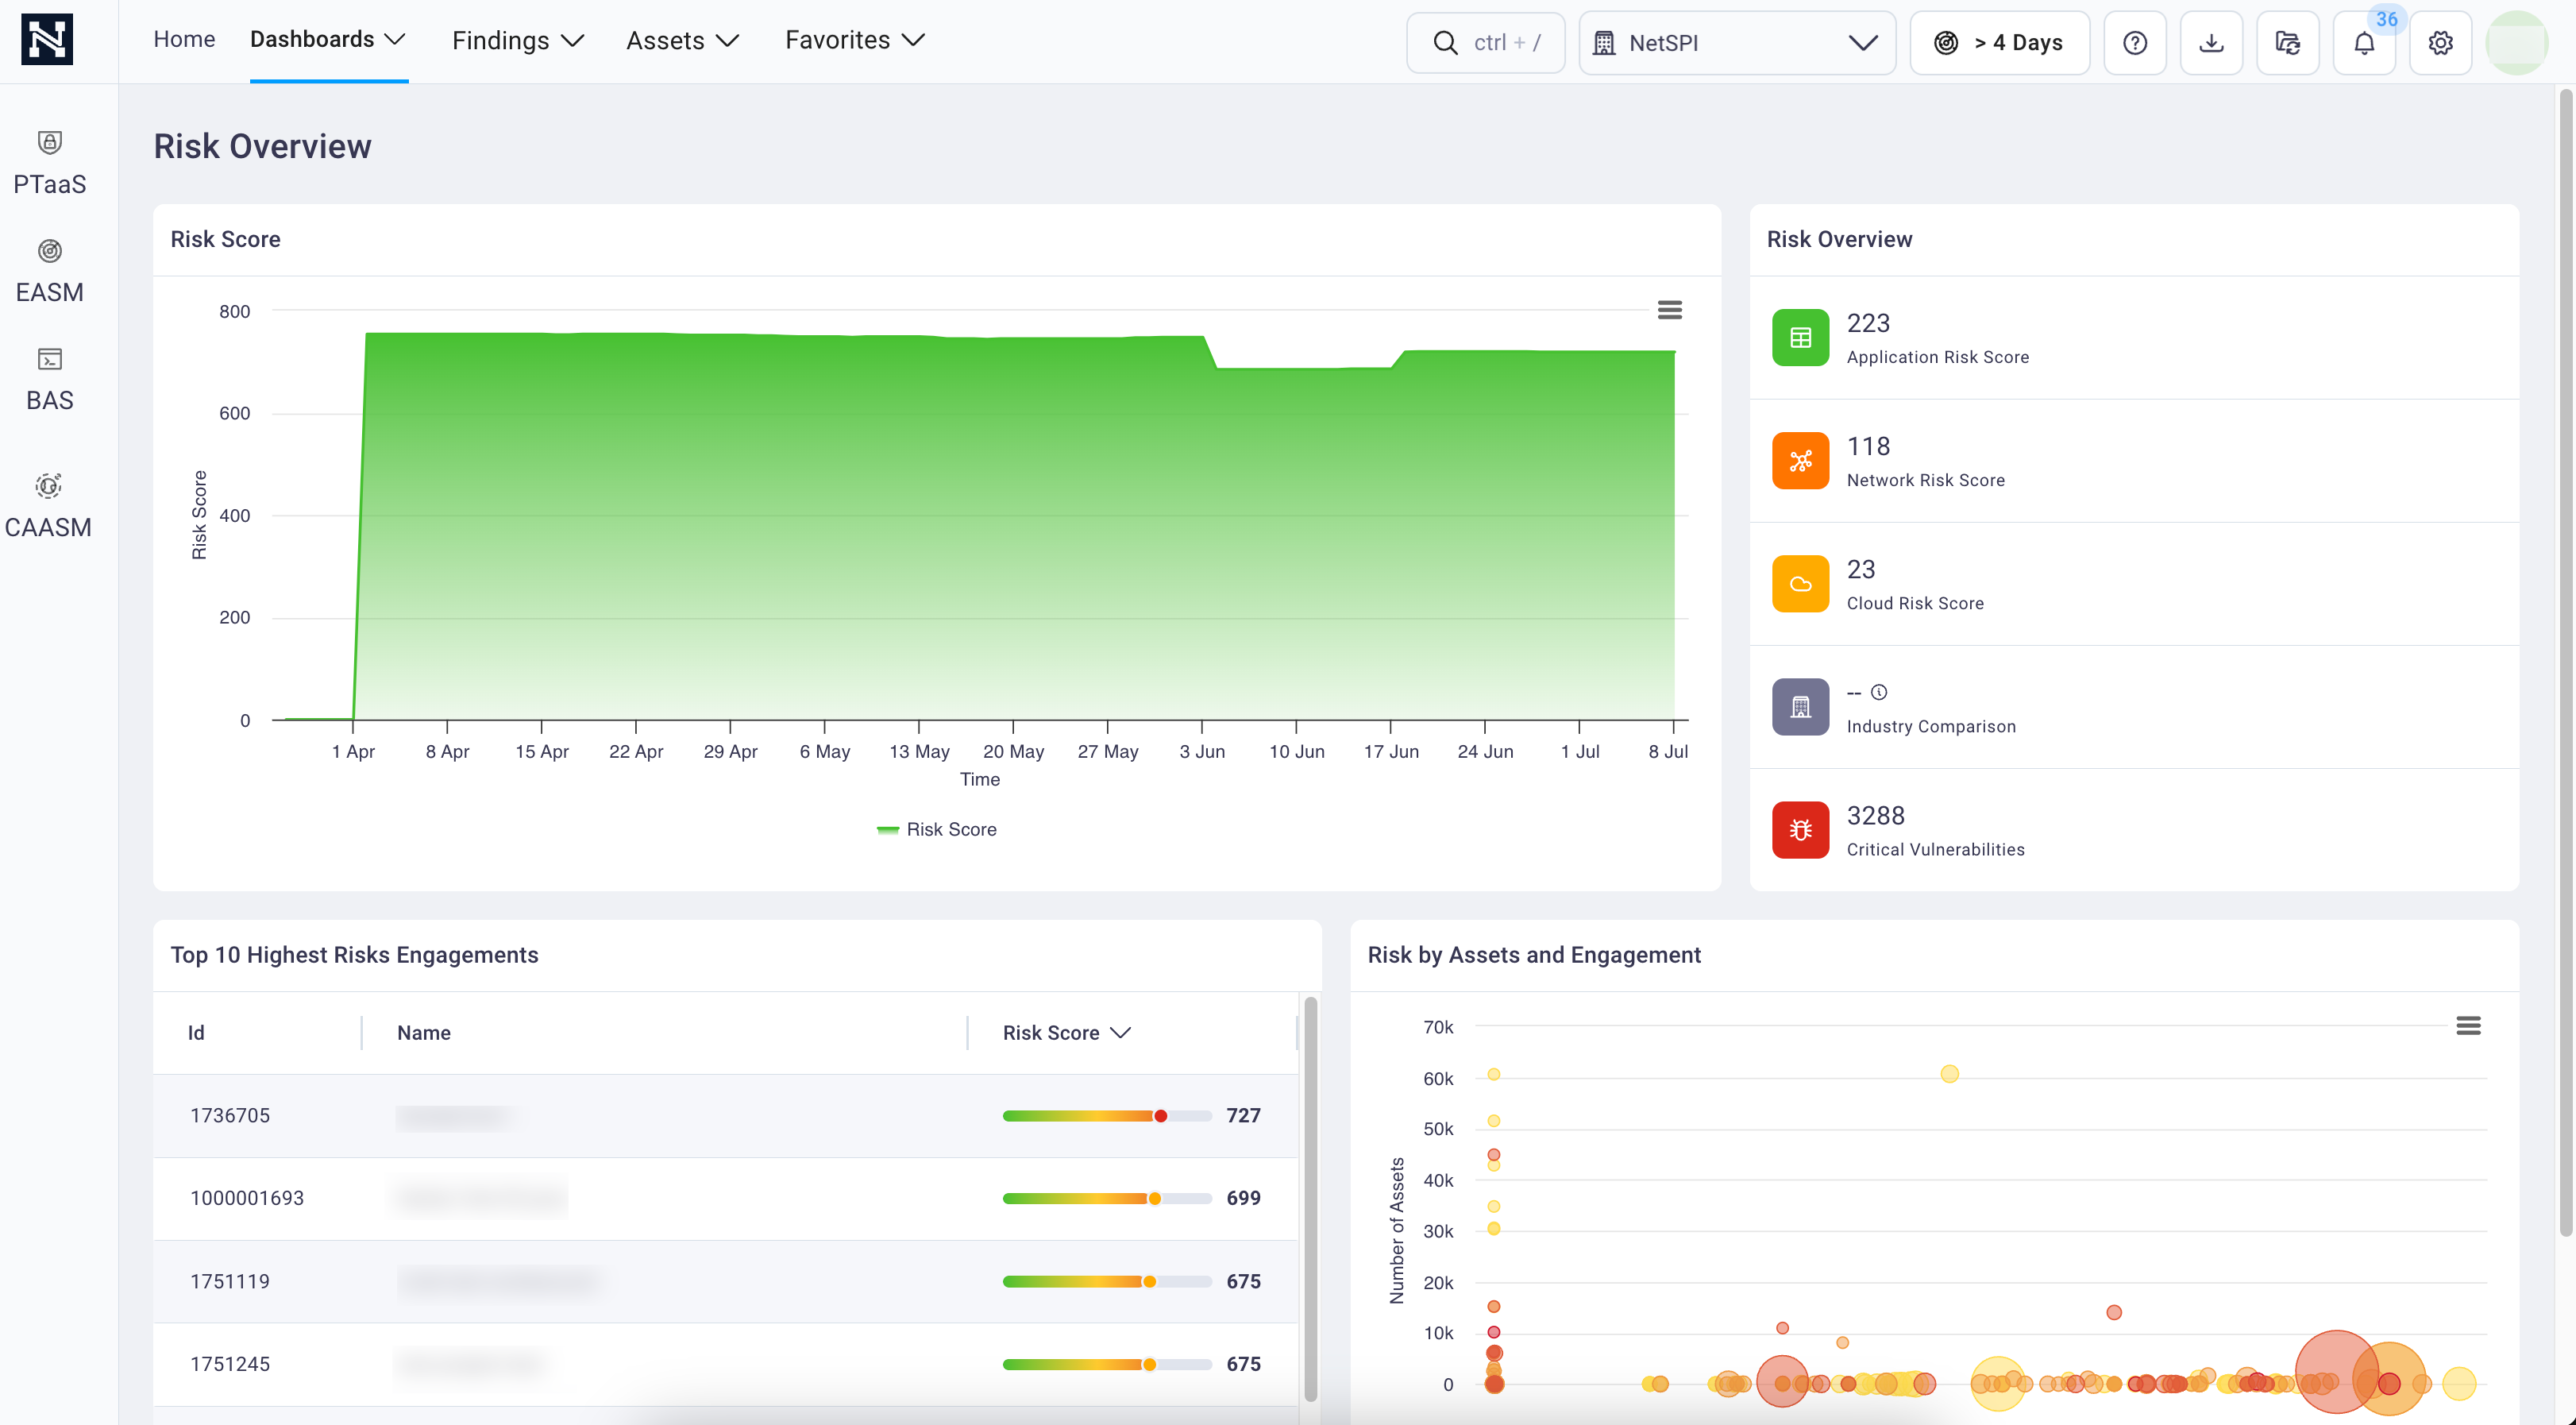
3. Workspace area
The Workspace area is the inner section of the page where the details display for whichever functionality you’ve selected from the side or top navigation options (i.e., Dashboards, Findings, Assets, etc.). Pages that display here often include links that open up other pages, such as Finding detail or Asset detail pages, etc.