#
Working with attack narratives
The goal of the Attack Narrative is to educate you on the impact of the vulnerabilities that NetSPI Agents found so that it's clear how the exploits were used together to achieve the objective. For example, we identified three vulnerabilities and, in this order, we were able to access your credit card information or your healthcare data, etc.
Attack narratives are the result of NetSPI Agents exploiting any found vulnerabilities to gain access to an application, a system, or some kind of sensitive data. If they get onto a system, they do secondary reconnaissance to allow them to find addition repositories that allows them to pivot from th eInternet to inside your network, whether cloud or on premises. They will exploit a series of vulnerabilities to get to their objective. Each major phase is presented as a step in the Attack Narrative view.
All that data was already in the Platform. With the Attack Narrative, we've created an interface that allows our NetSPI Agents to build these stories visually and to enforce some consistency (for NetSPI Agents) so that the way these stories are told is the same, no matter the Agent.
#
Accessing the attack narrative
Attack narratives are accessed by engagement.
- Hover over PTaaS in the left navigation, and select Engagements to display the Engagements page.
- Select any engagement row to display its Engagement Details page.
Select the Attack Narrative tab to display the Attack Narratives table with all the attack narratives for that engagement.
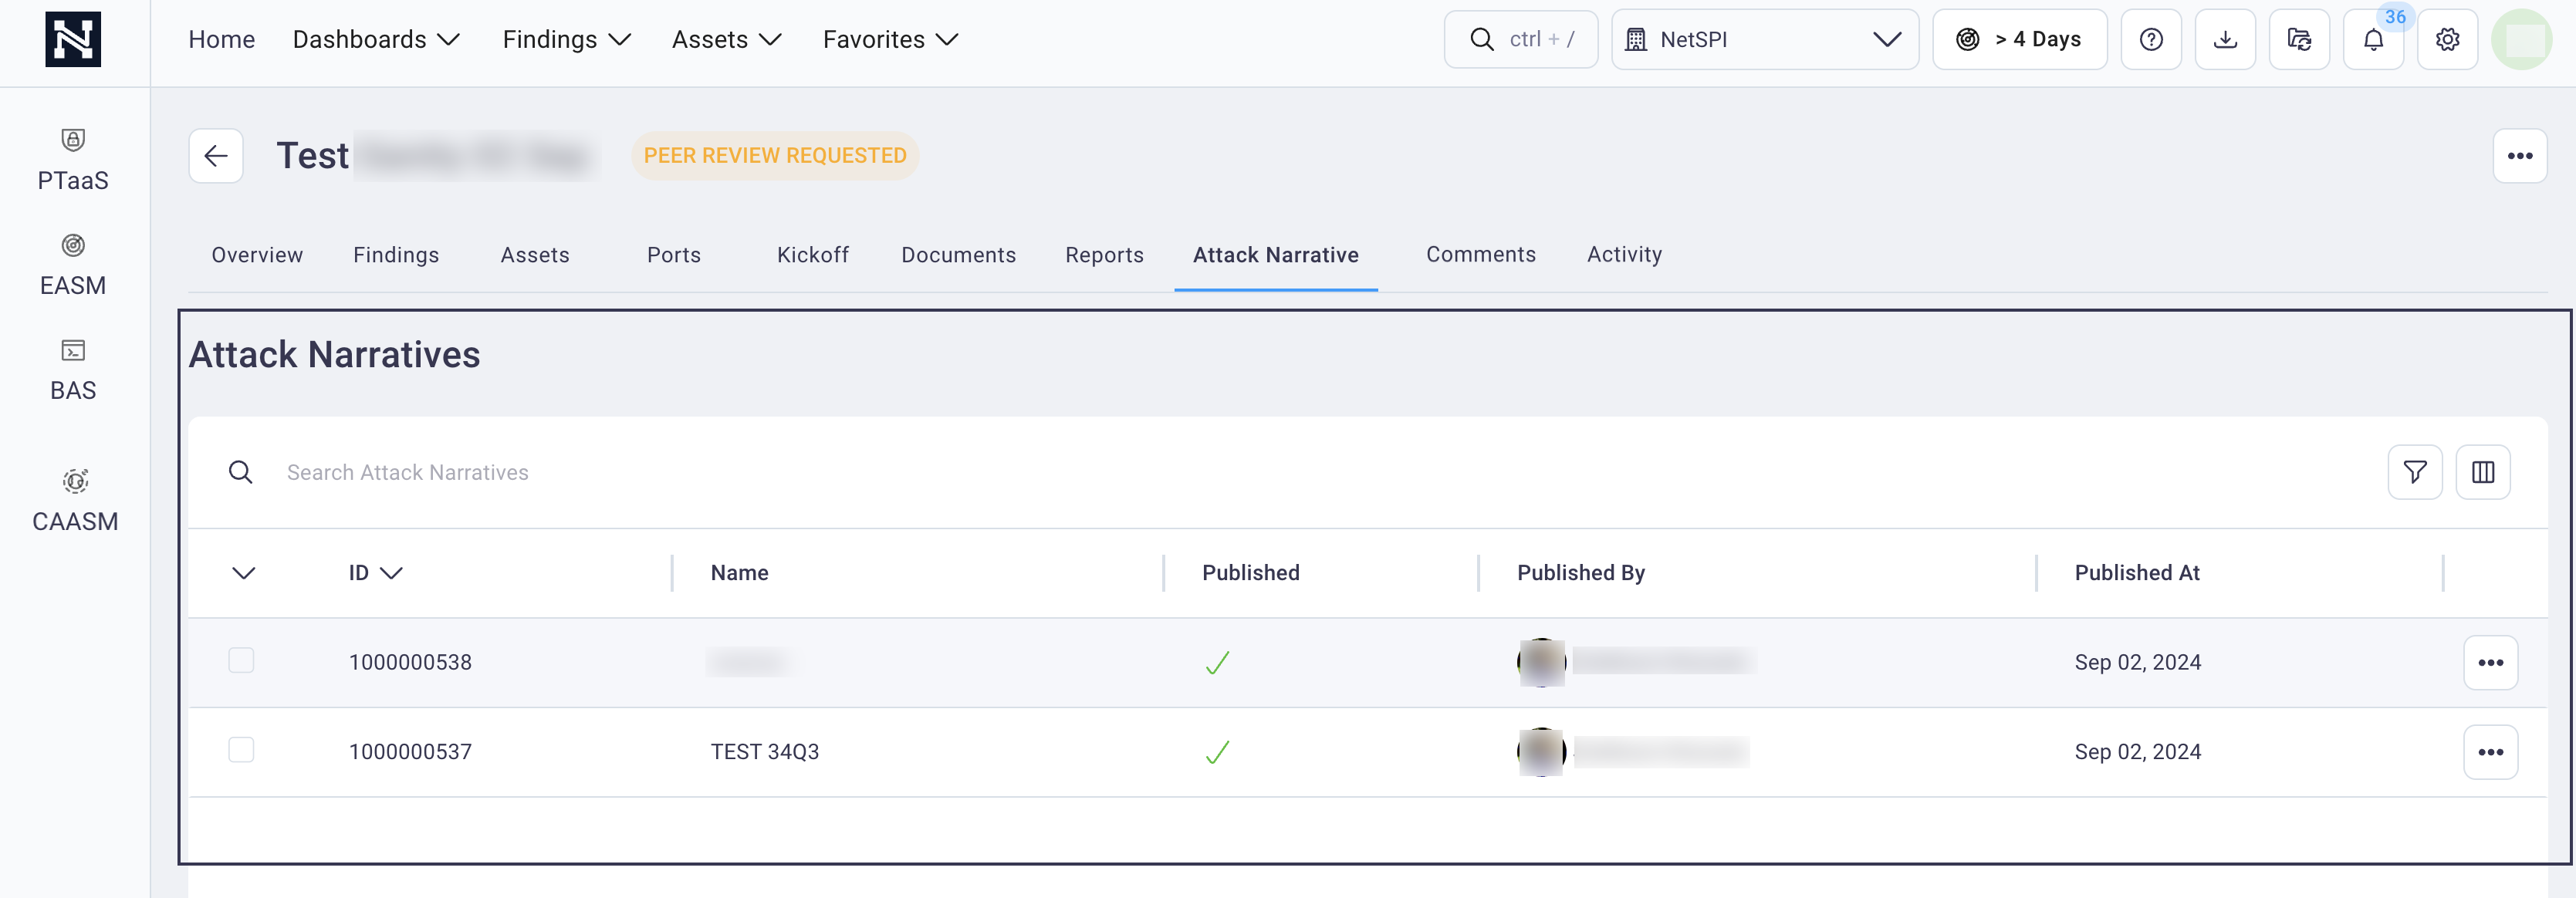
Select an Attack Narrative table row to display an attack narrative.
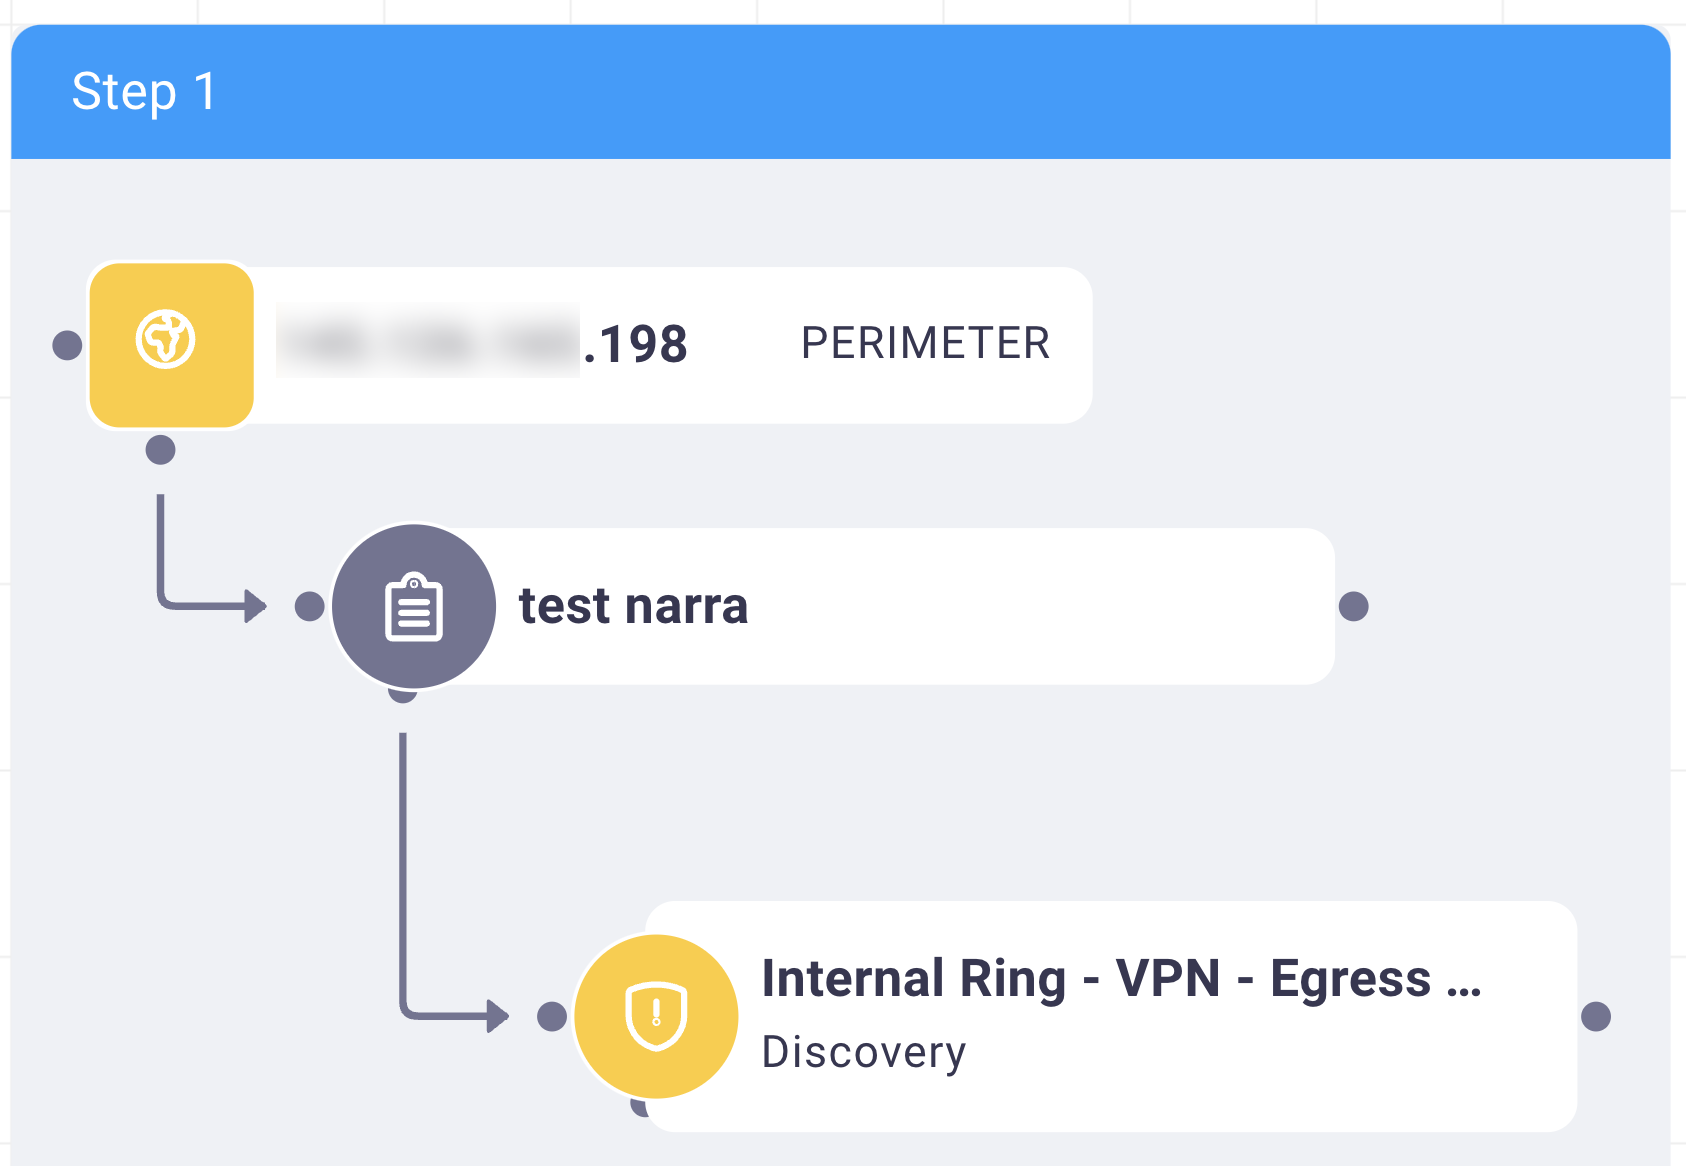
Use the lower left controls
 to zoom in, zoom out, fit the narrative to optimal
viewing on the page, and toggle the attack narrative view on or off.
Use the top Attack Narrative controls
 to change the view.
Views (left to right in image above) include step view, map view, timeline view, and MITRE Att&ck view. Each of these views is detailed below. On all possible attack narrative views, you are able to select an asset or finding to view its details.
For example:
- For an asset, you will view Asset details and what findings are associated with that asset.
- For a finding, you can select the finding in the attack narrative to view details such as severity, remediation instructions, MITRE Att&ck information, etc.
#
Step view
The step view shows you each step the NetSPI Agent took to accomplish the objective. What differentiates one step from the next is the perimeter. A threshold is established between two assets or two environments. Moving from an application to a GitHub account (a SaaS provider), for example. This illustrates a clear line between the application compromise and the SaaS compromise and how they relate to each other.
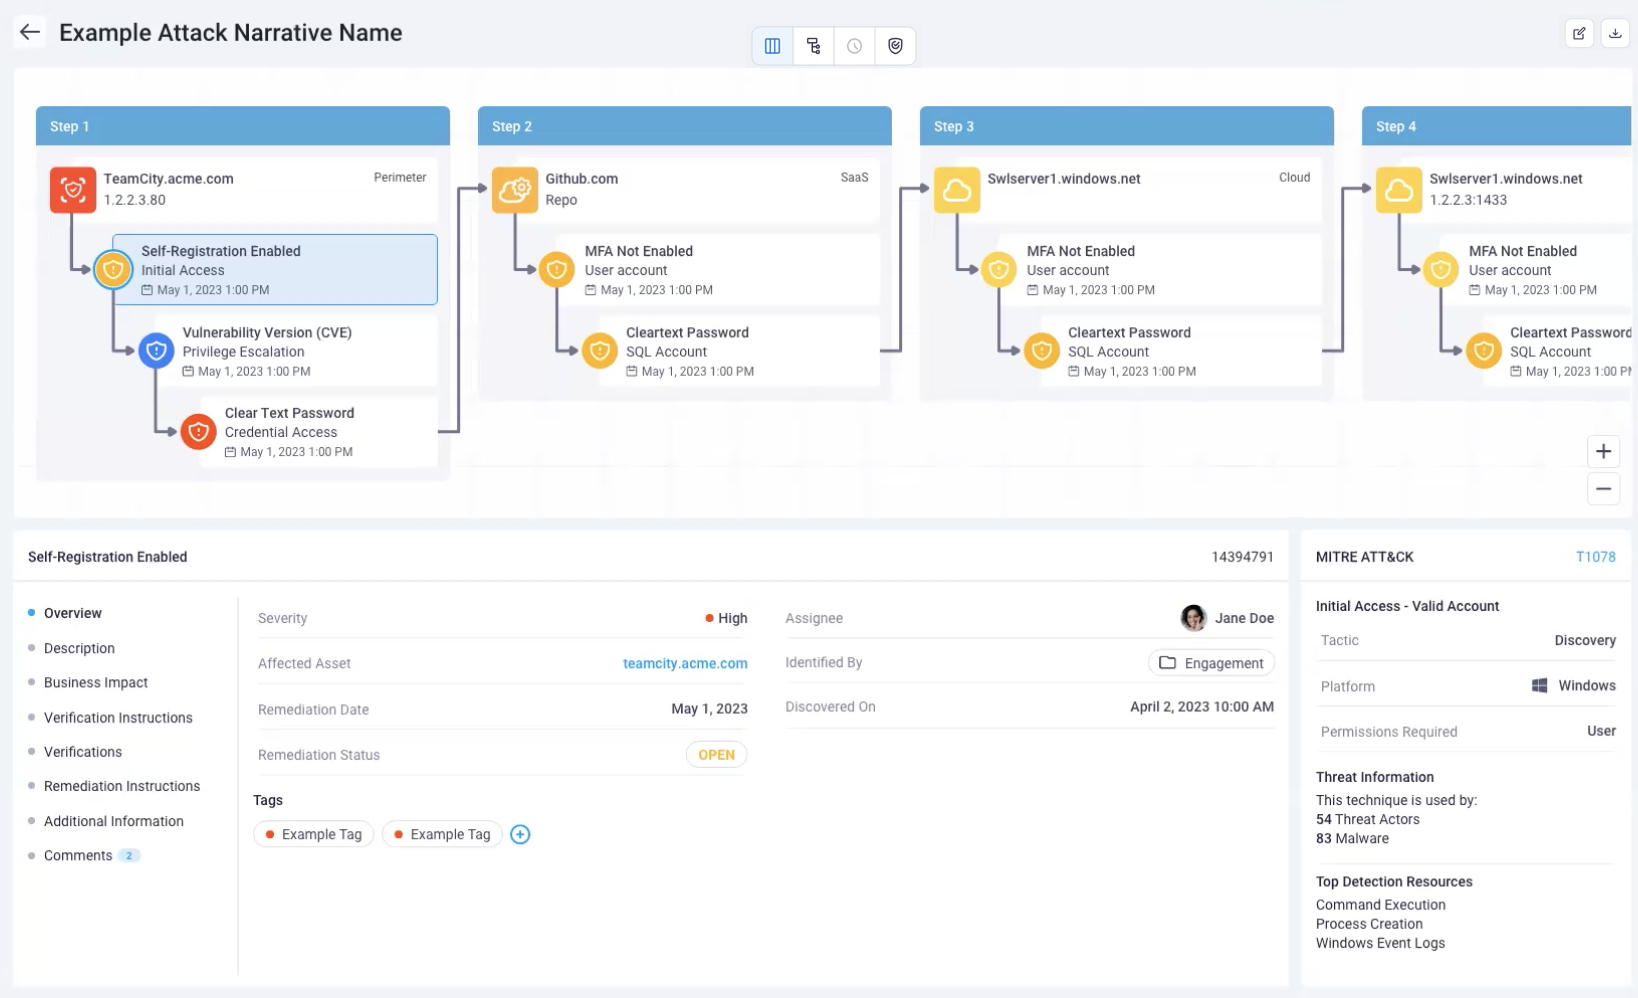
The steps help the NetSPI Agent conceptualize each of these phases, but also help you, in the NetSPI Platform, to understand the initial vulnerabilities that were able to be exploited and what came after (the dependencies for escalation).
In many cases fixing step one may stop the flow from left to right for example (remediation). The step view reflects some order of priority when you go to fix these problems. The far left step is the biggest priority and the steps further to the right are lower in priority.
Who gets the most from this view?
A knowledgeable Client who can follow along with the map view and understand the priorities and dependence in context.
#
Map view
In map view, the focus is on which zones the assets are contained in and how the NetSPI Agent traverses through those zones. The map view is perfect for a higher level audience, who may need to understand: how bad is it and where are the problems?
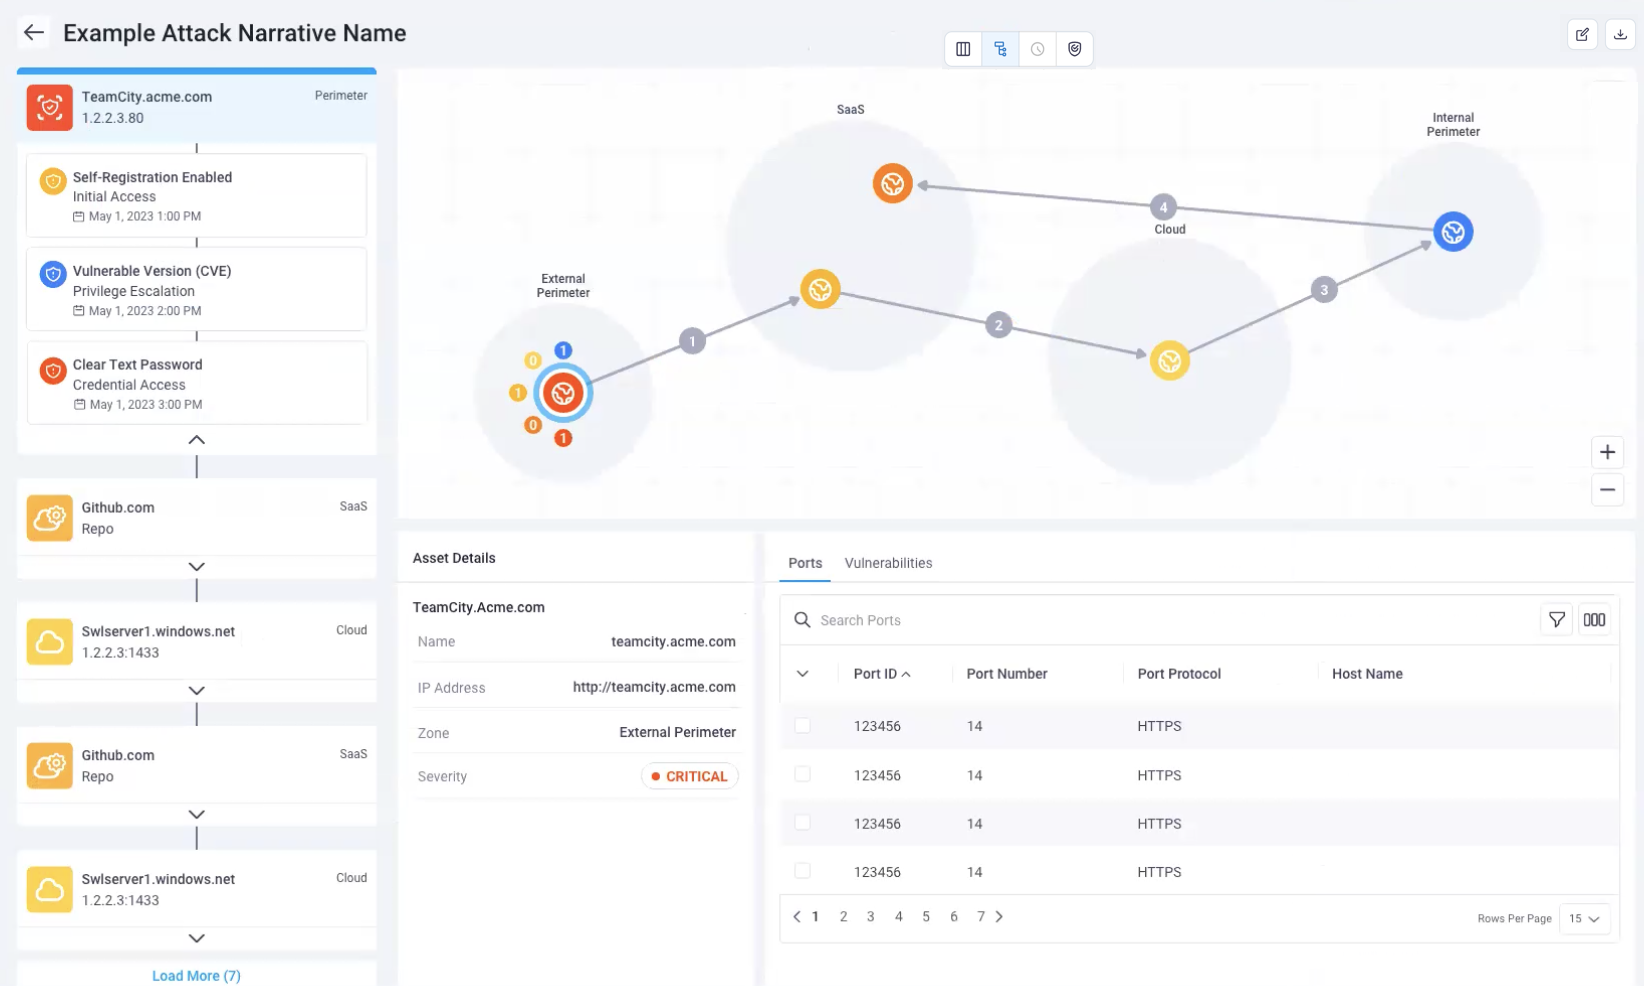
The map view shows anything in red can be considered "really bad"; something that needs to be fixed right away. Other items are color coded to severity to get a rough feeling for where your worst issues are and which order to fix them.
The arrows show how an attacker would traverse the environments and in which order. It all starts with the external perimeter, flows next to the SaaS provider (in the example above), then flows into the cloud environment, to the internal environment, and then back into the SaaS environment. We show we were able to compromise the majority of your assets through this escalation chain.
#
Timeline view
The Timeline view focuses more on the findings themselves. It is the only view to display findings information when you select items in the view.
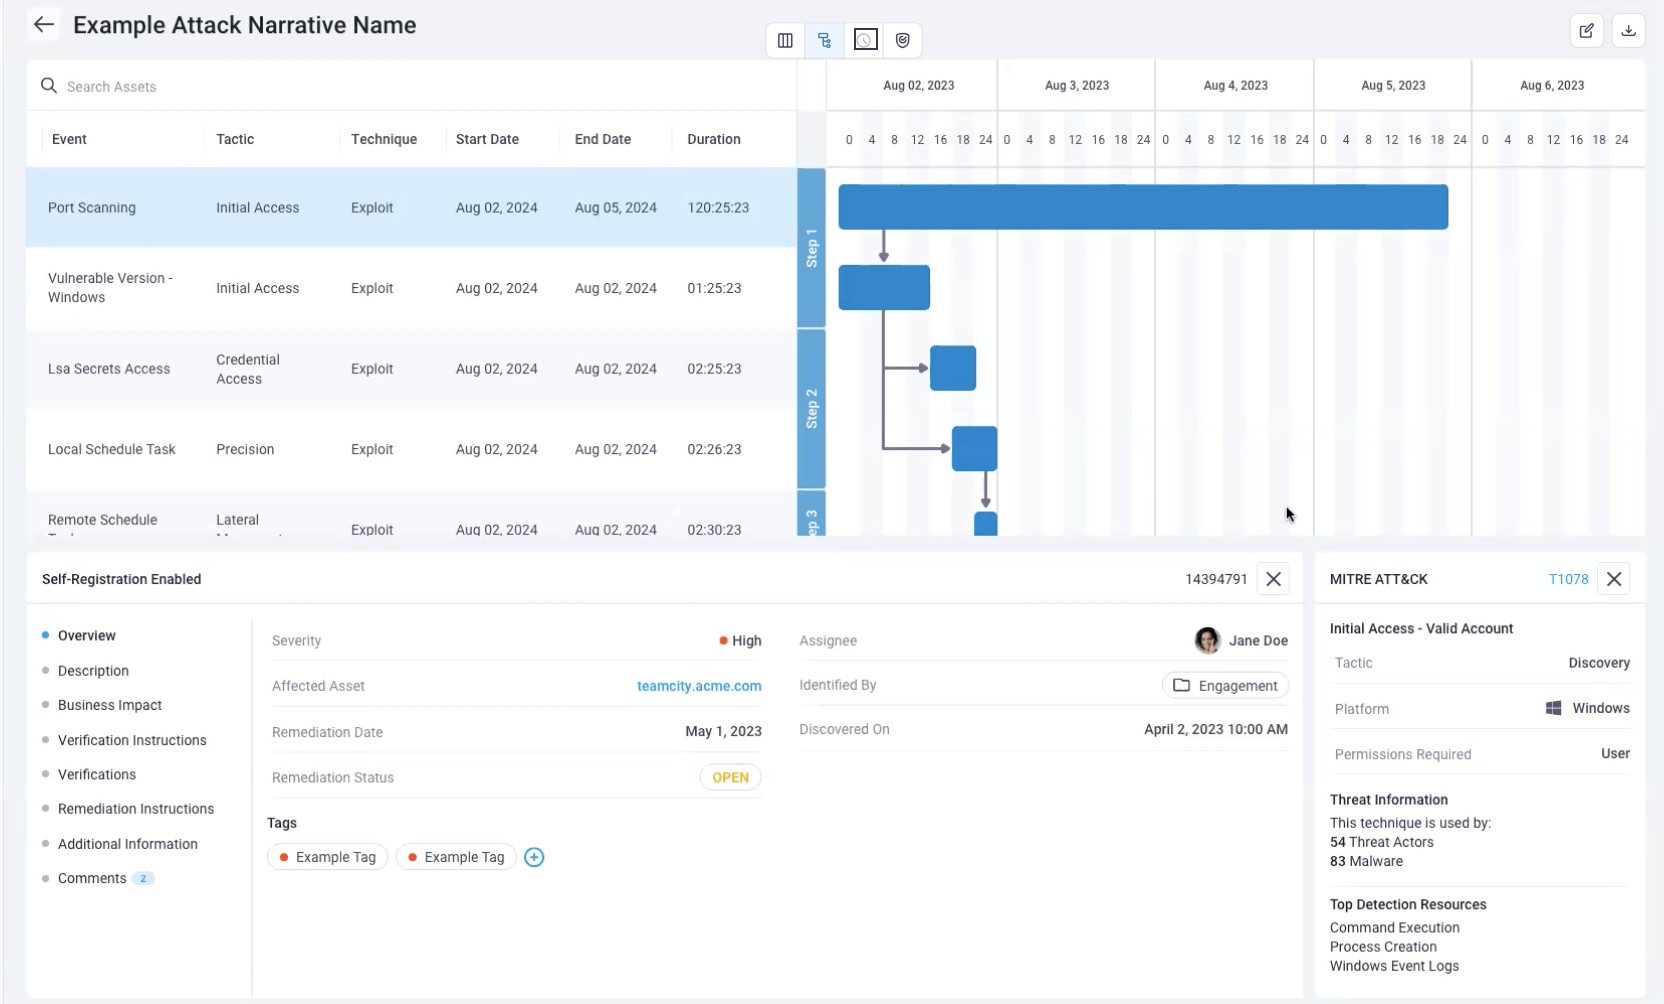
The timeline view maps out the events (a finding), when it took place, and how long it took for that to take place.
For example, it answers:
- Why did it take NetSPI so long to do this?
- What was the NetSPI Agent doing during this time to find this attack narrative?
- How the steps to discover the finding break down, time spent on each step, what the Agent was doing and how they flowed throughout this attack narrative process step by step with durations.
Red team engagements especially get a lot of value from the timeline view. Generally, the timeline view provides some time context for standard penetration tests or during red team engagements. In red team engagements, the Agent's goal is to break in and accomplish an objective without anybody knowing we ever did it. Only a few people in your organization are notified when they do.
The timeline view allows you to go back to your security operations team, who monitors and responds to security events in the environment, and paints them a picture of what the NetSPI Agent did, but also when they did it so that your SOC team can break down their event logs and evaluate where the near misses occurred so they can improve. Your security operations team can dig into all these things and get asset data where they need to.
#
MITRE Att&ck view
The MITRE Att&ck view breaks down both assets and findings into their MITRE tactics (shown at the top of the image below).
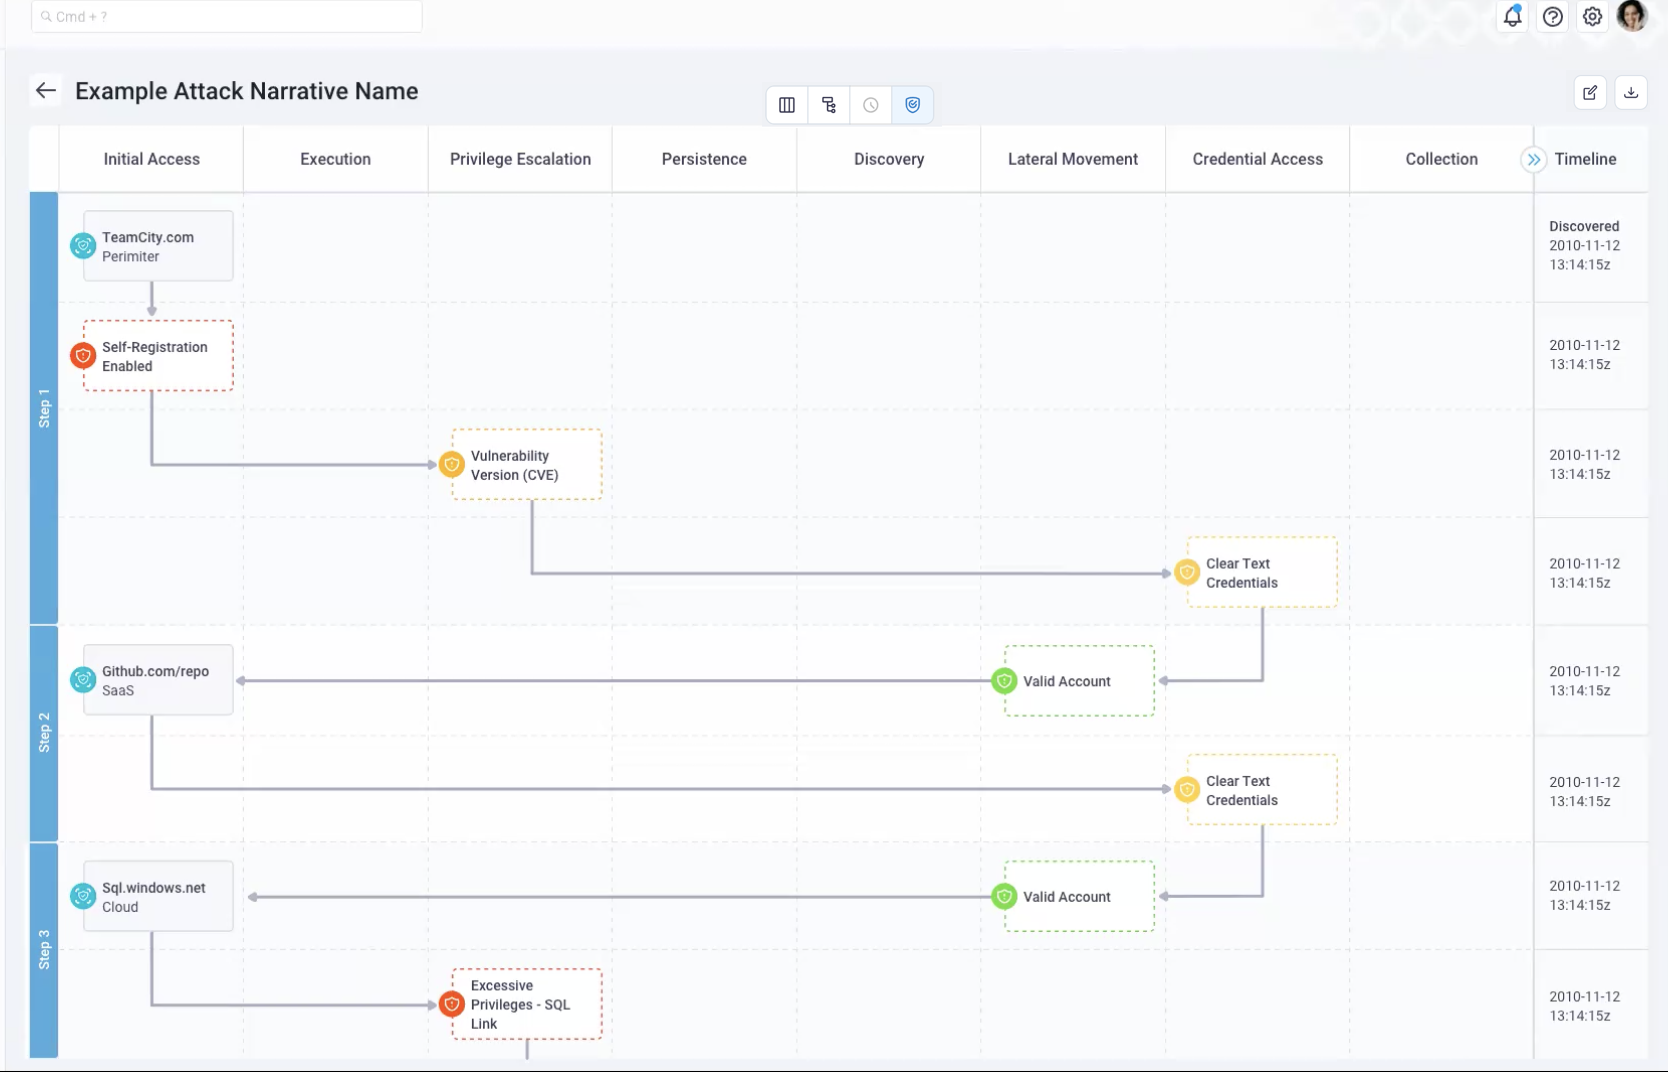
Seeing where things happen in the MITRE flow can be helpful to understanding a vulnerability and the remediation needed.
When viewing the MITRE tactics (Initial Access, Execution, etc.) consider that MITRE Att&ck as a whole covers three big buckets: tactics, techniques, and procedures.
#
Tactics
The tactics (Initial Access, Execution, etc.) represent the "why". "Why am I taking this action as an attacker? Am I taking action to gain initial access? To escalate privileges? To move laterally or exfiltrate data?"
#
Techniques and Procedures
The individual techniques, which are represented by the findings that you see in the steps in the MITRE Att&ck view, could be vulnerabilities, malicious actions, etc. These items fall into the technique bucket or the "how", both generally and specifically (e.g., I ran this exact command).
#
Timeline
On the right of the MITRE Att&ck view, the Timeline displays to provide additional context. This illustrates and confirms that NetSPI performed this action.
Note: MITRE has become the authoritative taxonomy or classification system for attack behavior. Most security vendors, whether software or service related, map all of their vulnerabilities or malicious actions to the framework.

