

Vulnerabilities
A vulnerability is a security flaw found on an asset.
Vulnerabilities are available to manage in three main areas of the platform. Under the Vulnerabilities menu, select Open to review items that still require action, or Closed to review items that are resolved or no longer need attention. These pages combine vulnerabilities found through engagements as well as free offerings.


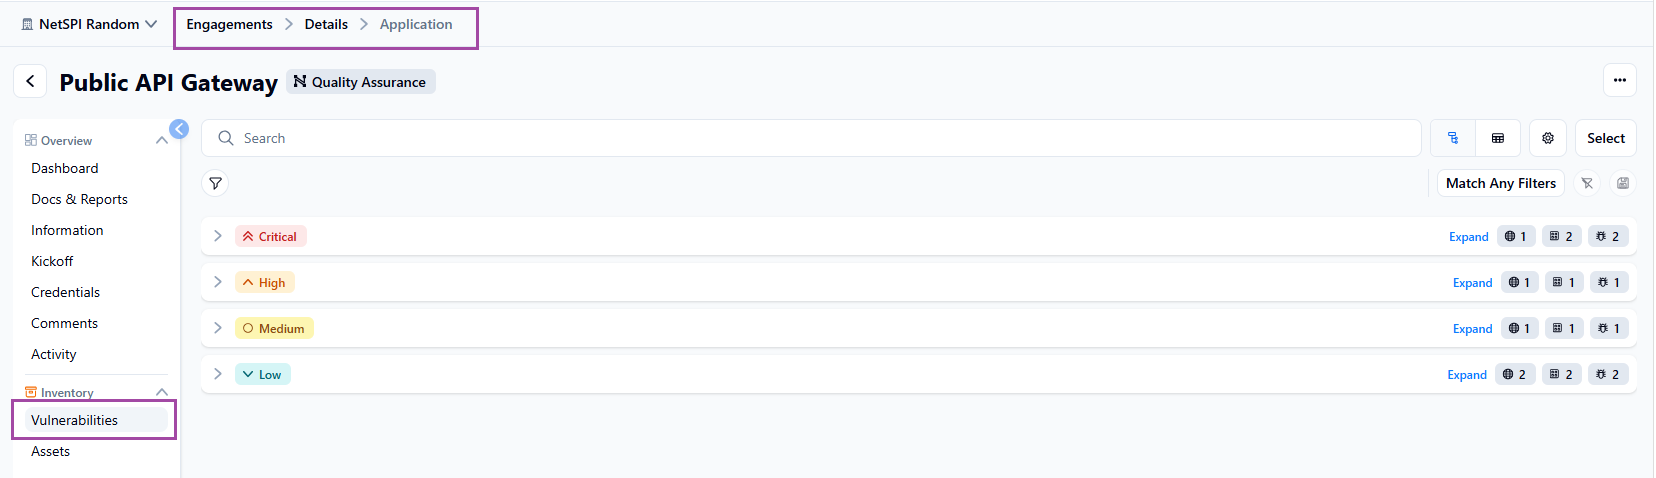
To view vulnerabilities for a specific engagement, go to Engagements, open the engagement (click the card) and select the Vulnerabilities menu item.
Vulnerability dashboard
The Closed Vulnerabilities and Opened Vulnerabilities widgets display at-a-glance overview of the number of vulnerabilities based on state and severity.
For more information about vulnerability states, reference Vulnerability States and Definitions Vulnerability States and Definitions.
Additional widgets on the dashboard include Average Time to Remediate and Open vs Closed Vulnerabilities.
Average Time to Remediate widget
The Average Time to Remediate widget displays an at-a-glance overview of all vulnerabilities for each severity level and if they fall within SLA guidelines.
Configure SLA
For each of the severity levels, you can set the number of days to remediate starting on the day the entity is published or when it is assigned.
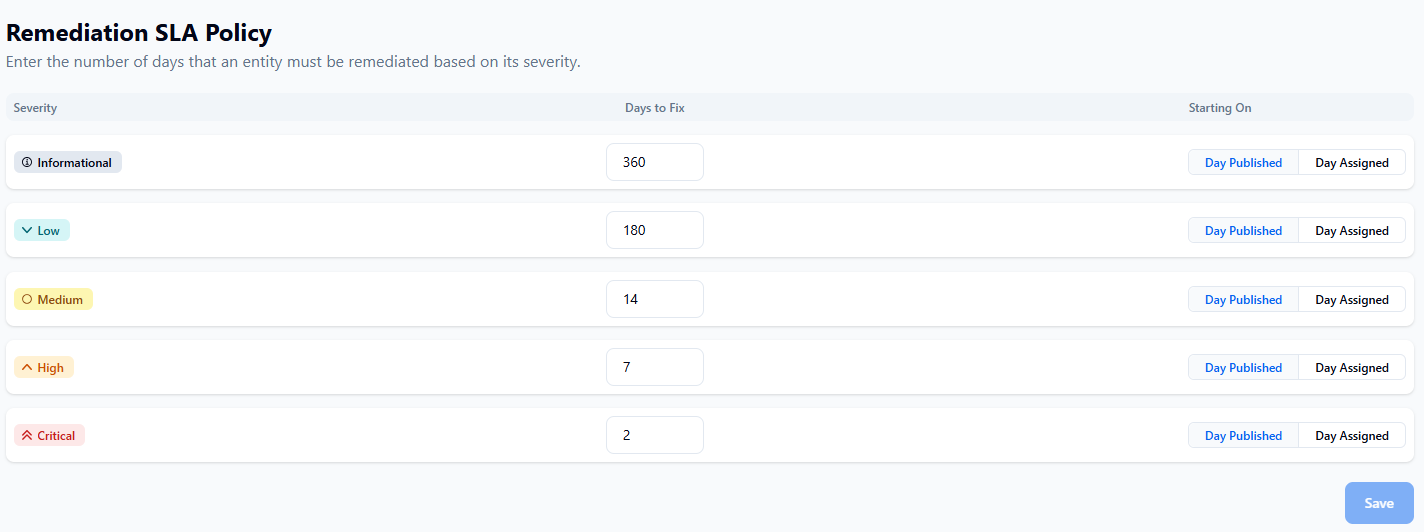
The SLA Configuration is also available from Settings > Admin > SLA Policy.
Open vs Closed Vulnerabilities widget
The Open vs Closed Vulnerabilities widget displays a line graph comparing opened vulnerabilities to closed vulnerabilities.
Widget settings
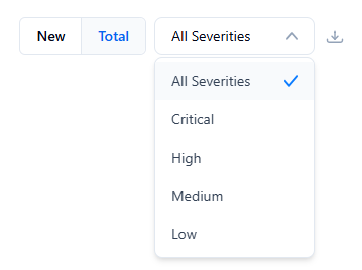
To adjust the displayed data, switch between the New and Total tabs, and choose different filter options from the available list.
Open Vulnerabilities and Closed Vulnerabilities
This documentation focuses on Open Vulnerabilities, but the same functionality also applies to Closed Vulnerabilities. The page offers two views: Tree and Table.
Tree view
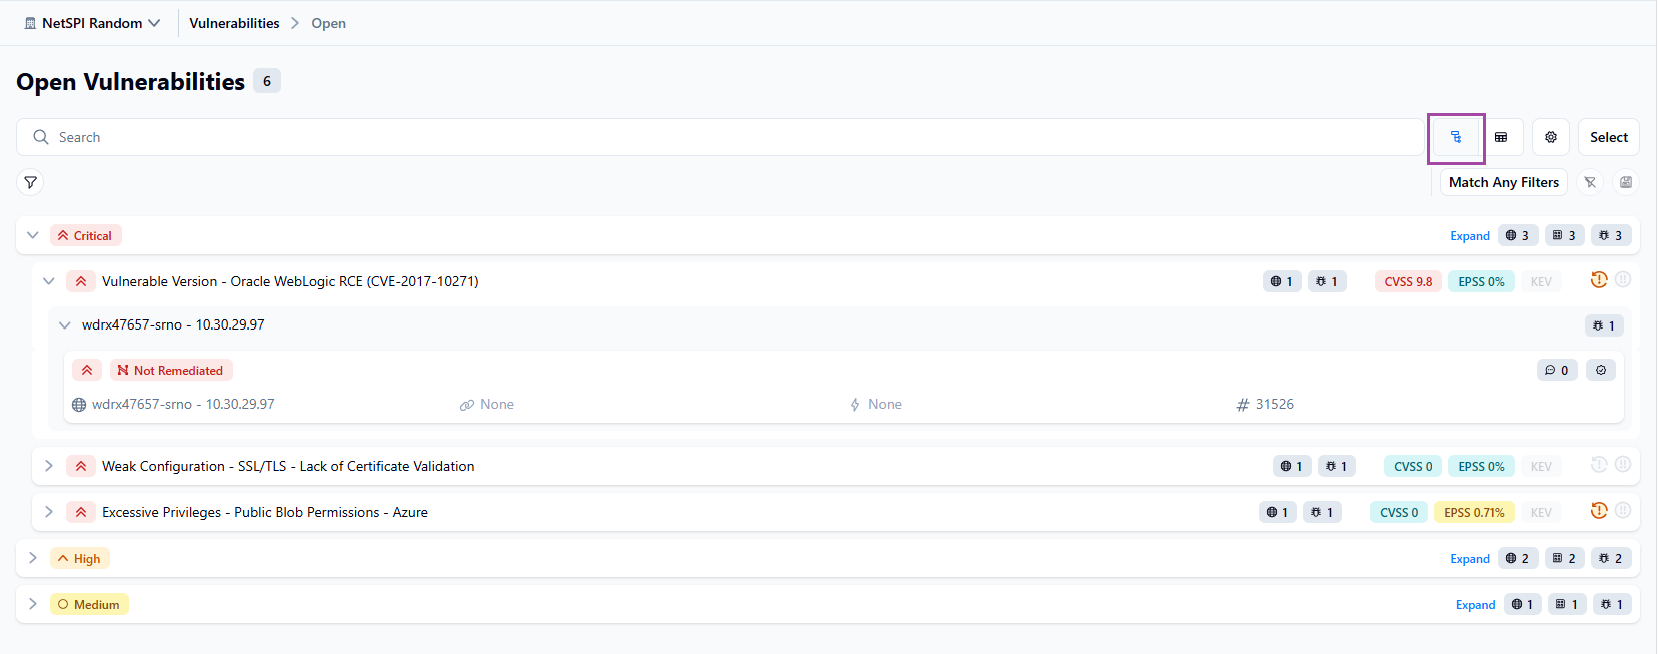
The Tree view is highly configurable to support different triage workflows. By default, it displays four levels: Severity, Vulnerability, Asset, and Instance. Each level provides at-a-glance context to help prioritize where to investigate.
Vulnerability level
At the Vulnerability level in Tree view, you can see:
- Severity
- Name
- Asset count
- Instance count
- CVSS
- EPSS
- Known Exploited Vulnerability status
Two additional indicators may also appear:
- NetSPI Previously Exploited means NetSPI has exploited the vulnerability before
- NetSPI Exploited means NetSPI exploited the vulnerability during engagements on one or more nested instances
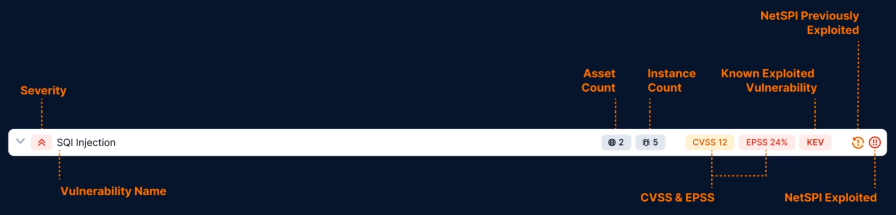
If any of the indicators do not apply to the specific vulnerability, they will be greyed out and dimmed.
Instance level
At the Instance level in Tree view, you can view:
- Severity
- State
- Remediation due date
- Assignee
- Comment count
- Verification availability
- Affected asset
- Affected URL
- Port and protocol
- Instance ID
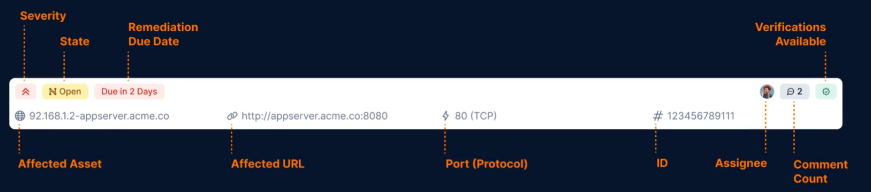
Click the Instance level to open the Vulnerabilities Details side panel.
Table view
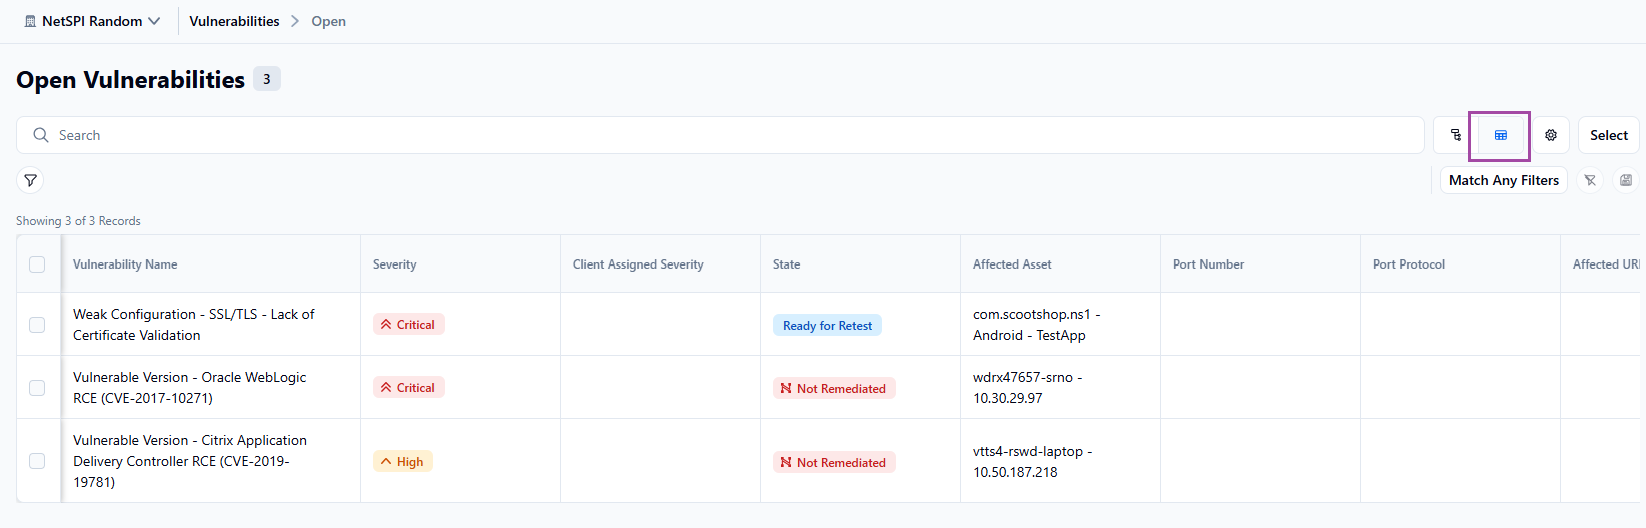
Use Table view to customize how your data appears. Adjust columns and filters to highlight the information most relevant to your use case.
Click on any row in the table to open the Vulnerabilities Details side panel.
Display configuration
If the default Tree or Table layout doesn't fit your workflow, select the Settings icon to open display configuration. Choose the Tree or Table tab to adjust the settings for that view.
On the Tree tab, you can reorder and customize tree levels to match your workflow, such as grouping by Engagement instead of Asset. You can also hide unneeded levels and set sorting options for each level.
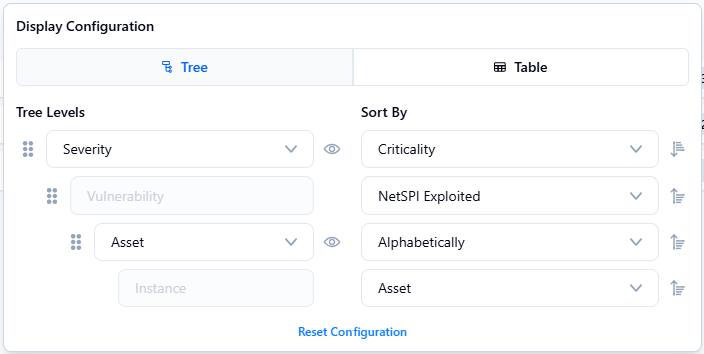
For more information about display configuration, reference Managing Grid Views.